OpsDash now provides easy-to-setup Elasticsearch monitoring. You can start monitoring your Elasticsearch cluster, nodes and indexes in just a few seconds, thanks to OpsDash’s smart dashboards that display the most important health and performance metrics with zero configuration.
OpsDash offers Elasticsearch monitoring integration at three levels:
- Overall Cluster-level Metrics for quick, aggregated overview of storage, JVM memory usage, segments and node and shard status
- Node-specific Metrics for a detailed look at a single node of the cluster, including storage, memory usage, index and query rates and cache efficiencies of various caches
- Index-specific Metrics for a detailed look at a single Elasticsearch index, including storage, segment and merge related metrics
Cluster Level
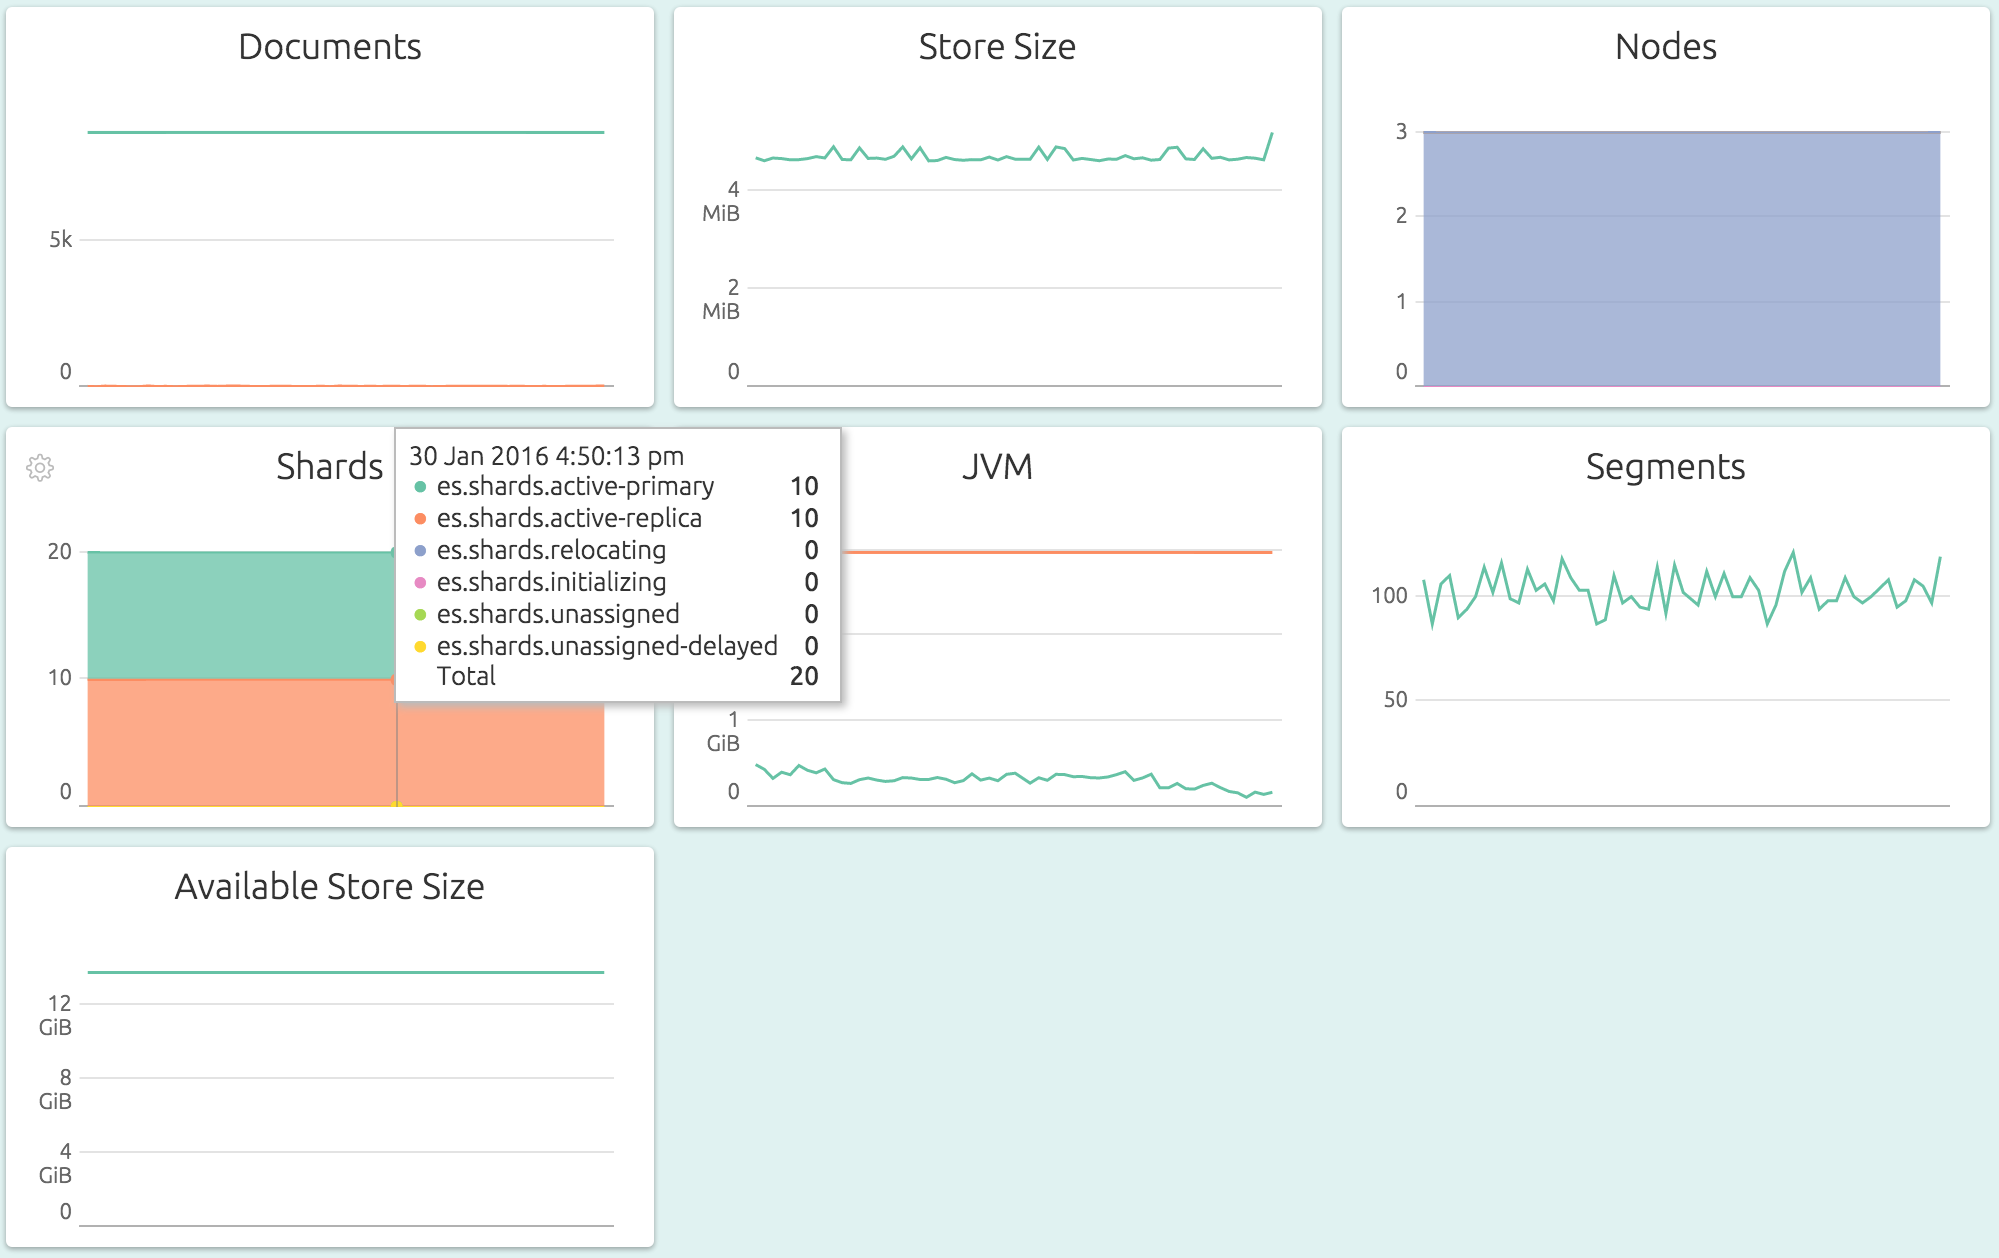
This dashboard shows a cluster storing about 8700 documents across 3 master+data nodes, split into 10 active and 10 replica shards. The total storage used is about 4.8MB out of 14.8GB available. The JVM heap usage is quite low, using only about 180MB of 3.2GB available. You’d have to mouseover to see the exact values.
In case you’re wondering, this is a cluster of three tiny VMs. Let’s see see the effect of two processes, one inserting documents and one querying them, on a particular index.
Index Level
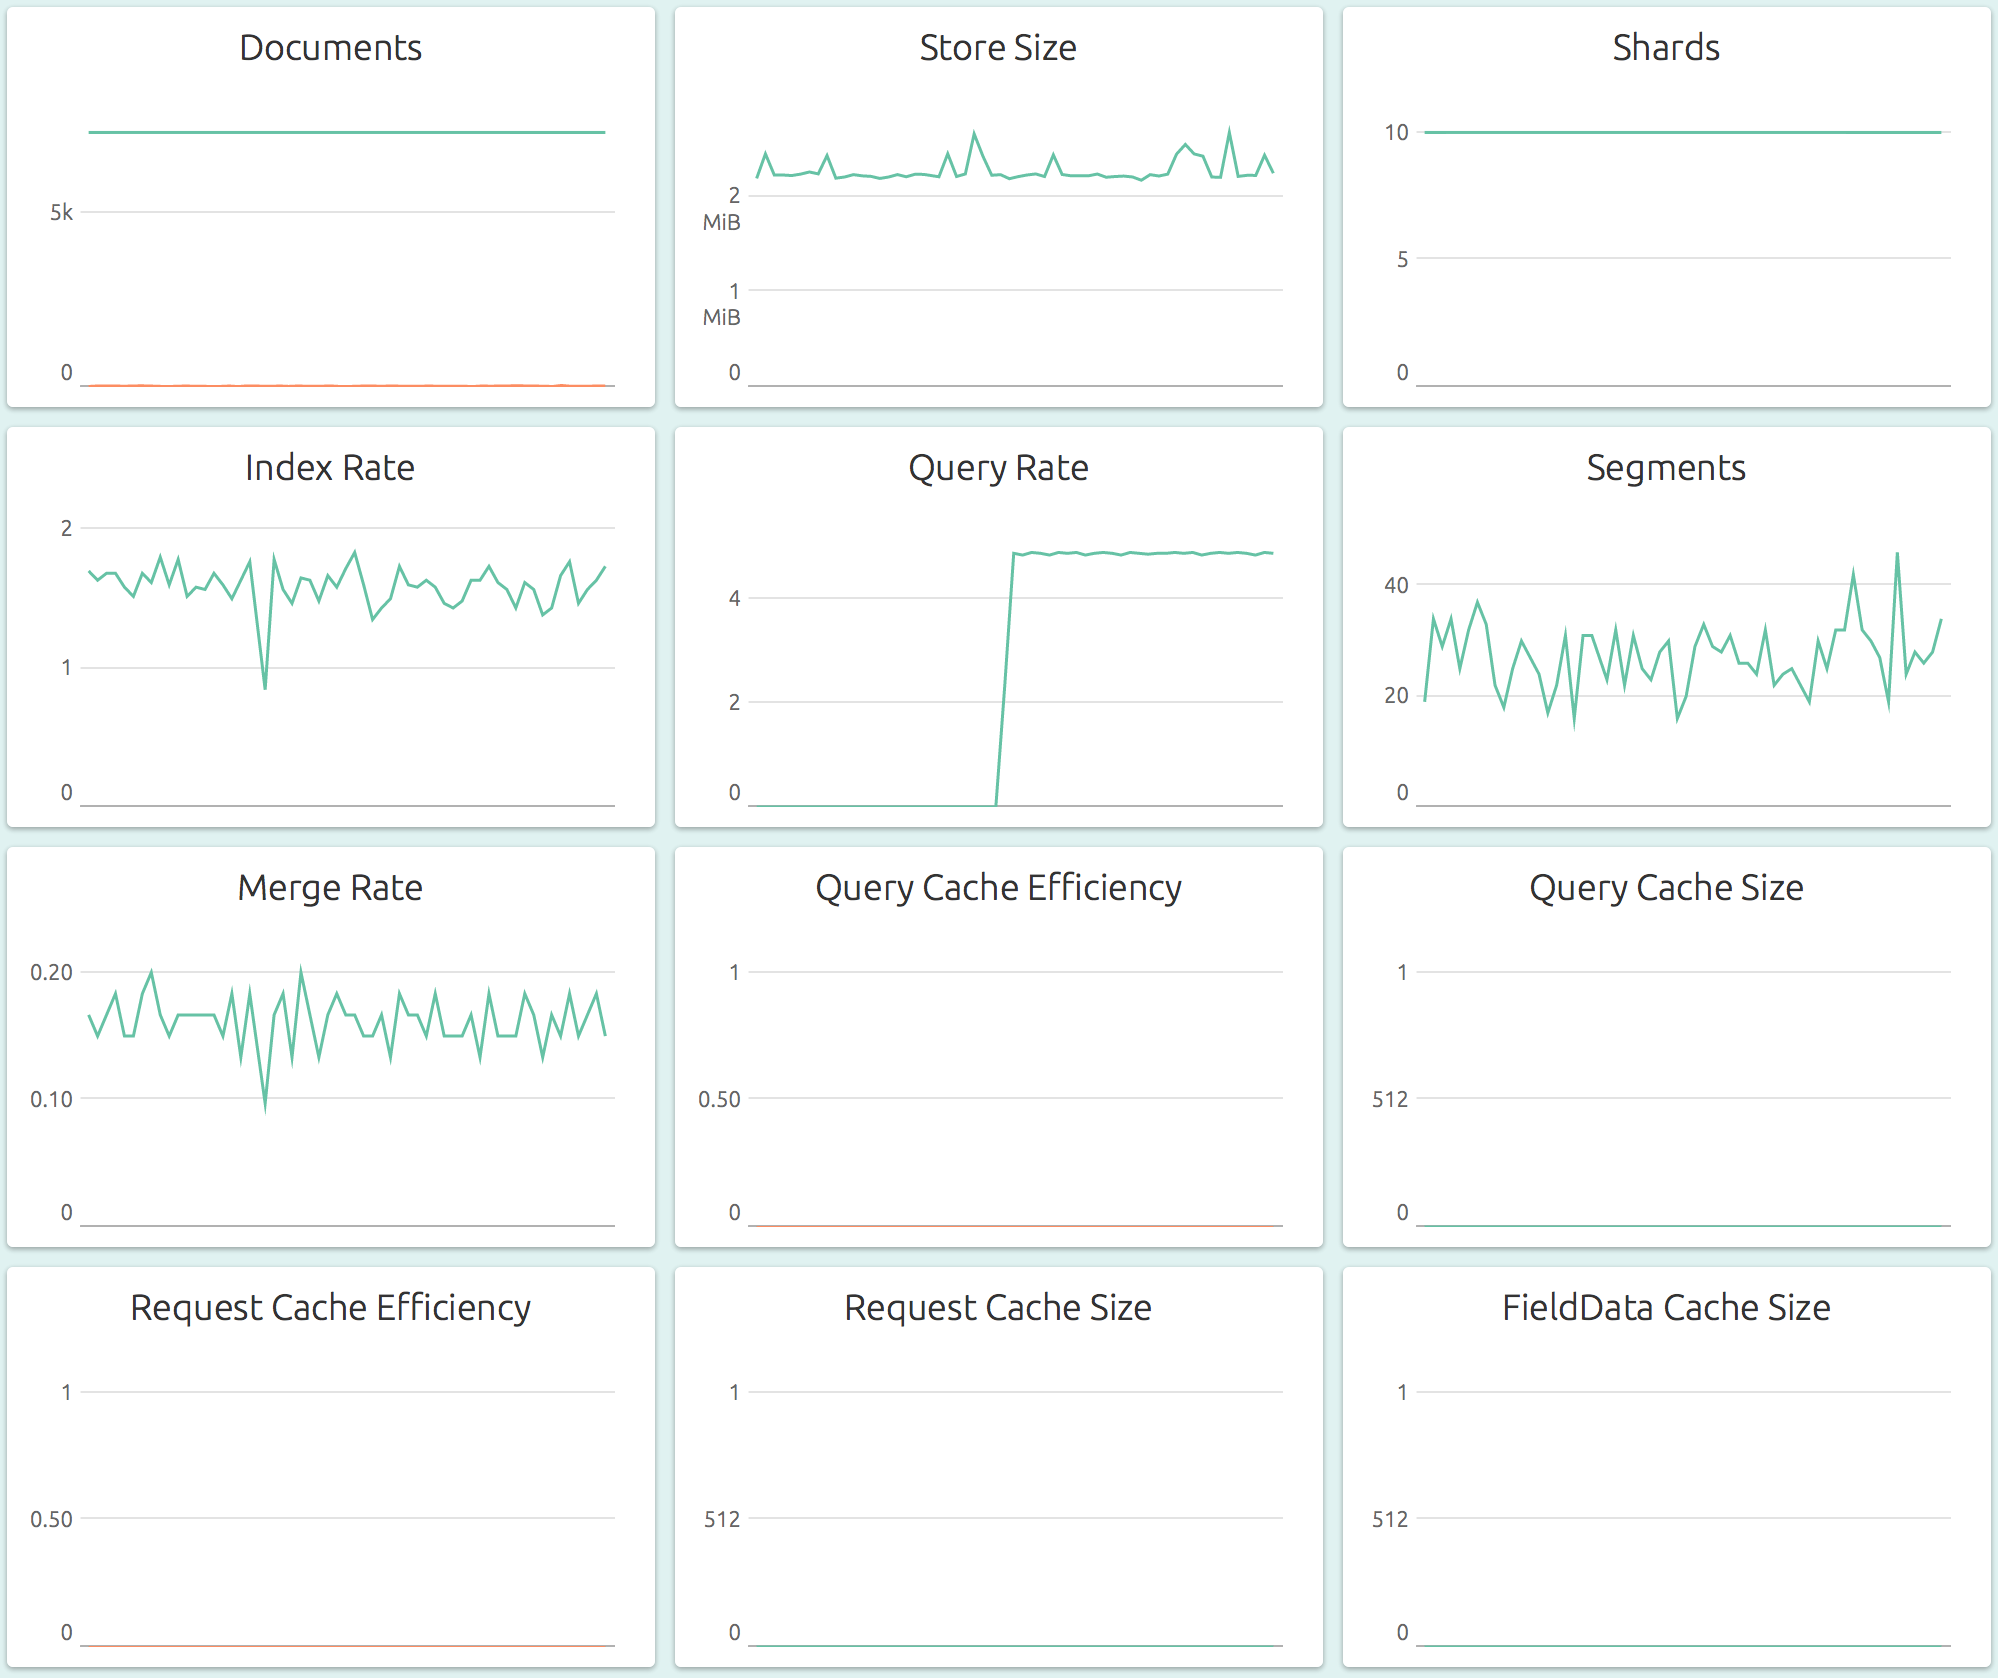
There is a steady rate of indexing (adding documents) of about 1.5/sec, but there does not seem to be any increase in the number of documents stored nor the storage used. This is because the documents are being overwritten, which is evidenced by a small, varying value of deleted document count (the orange line in the Documents graph). There is also a steady creation and merge of Lucene indexes (segments). A query process started recently, and is querying relentlessly at a rate of about 5 queries/sec. The caches aren’t configured here, but they will show the hits, misses and size used of each type of cache.
Node Level
Nodes are usually the best things to monitor in an Elasticsearch cluster, and OpsDash has the richest dashboards at the node level.
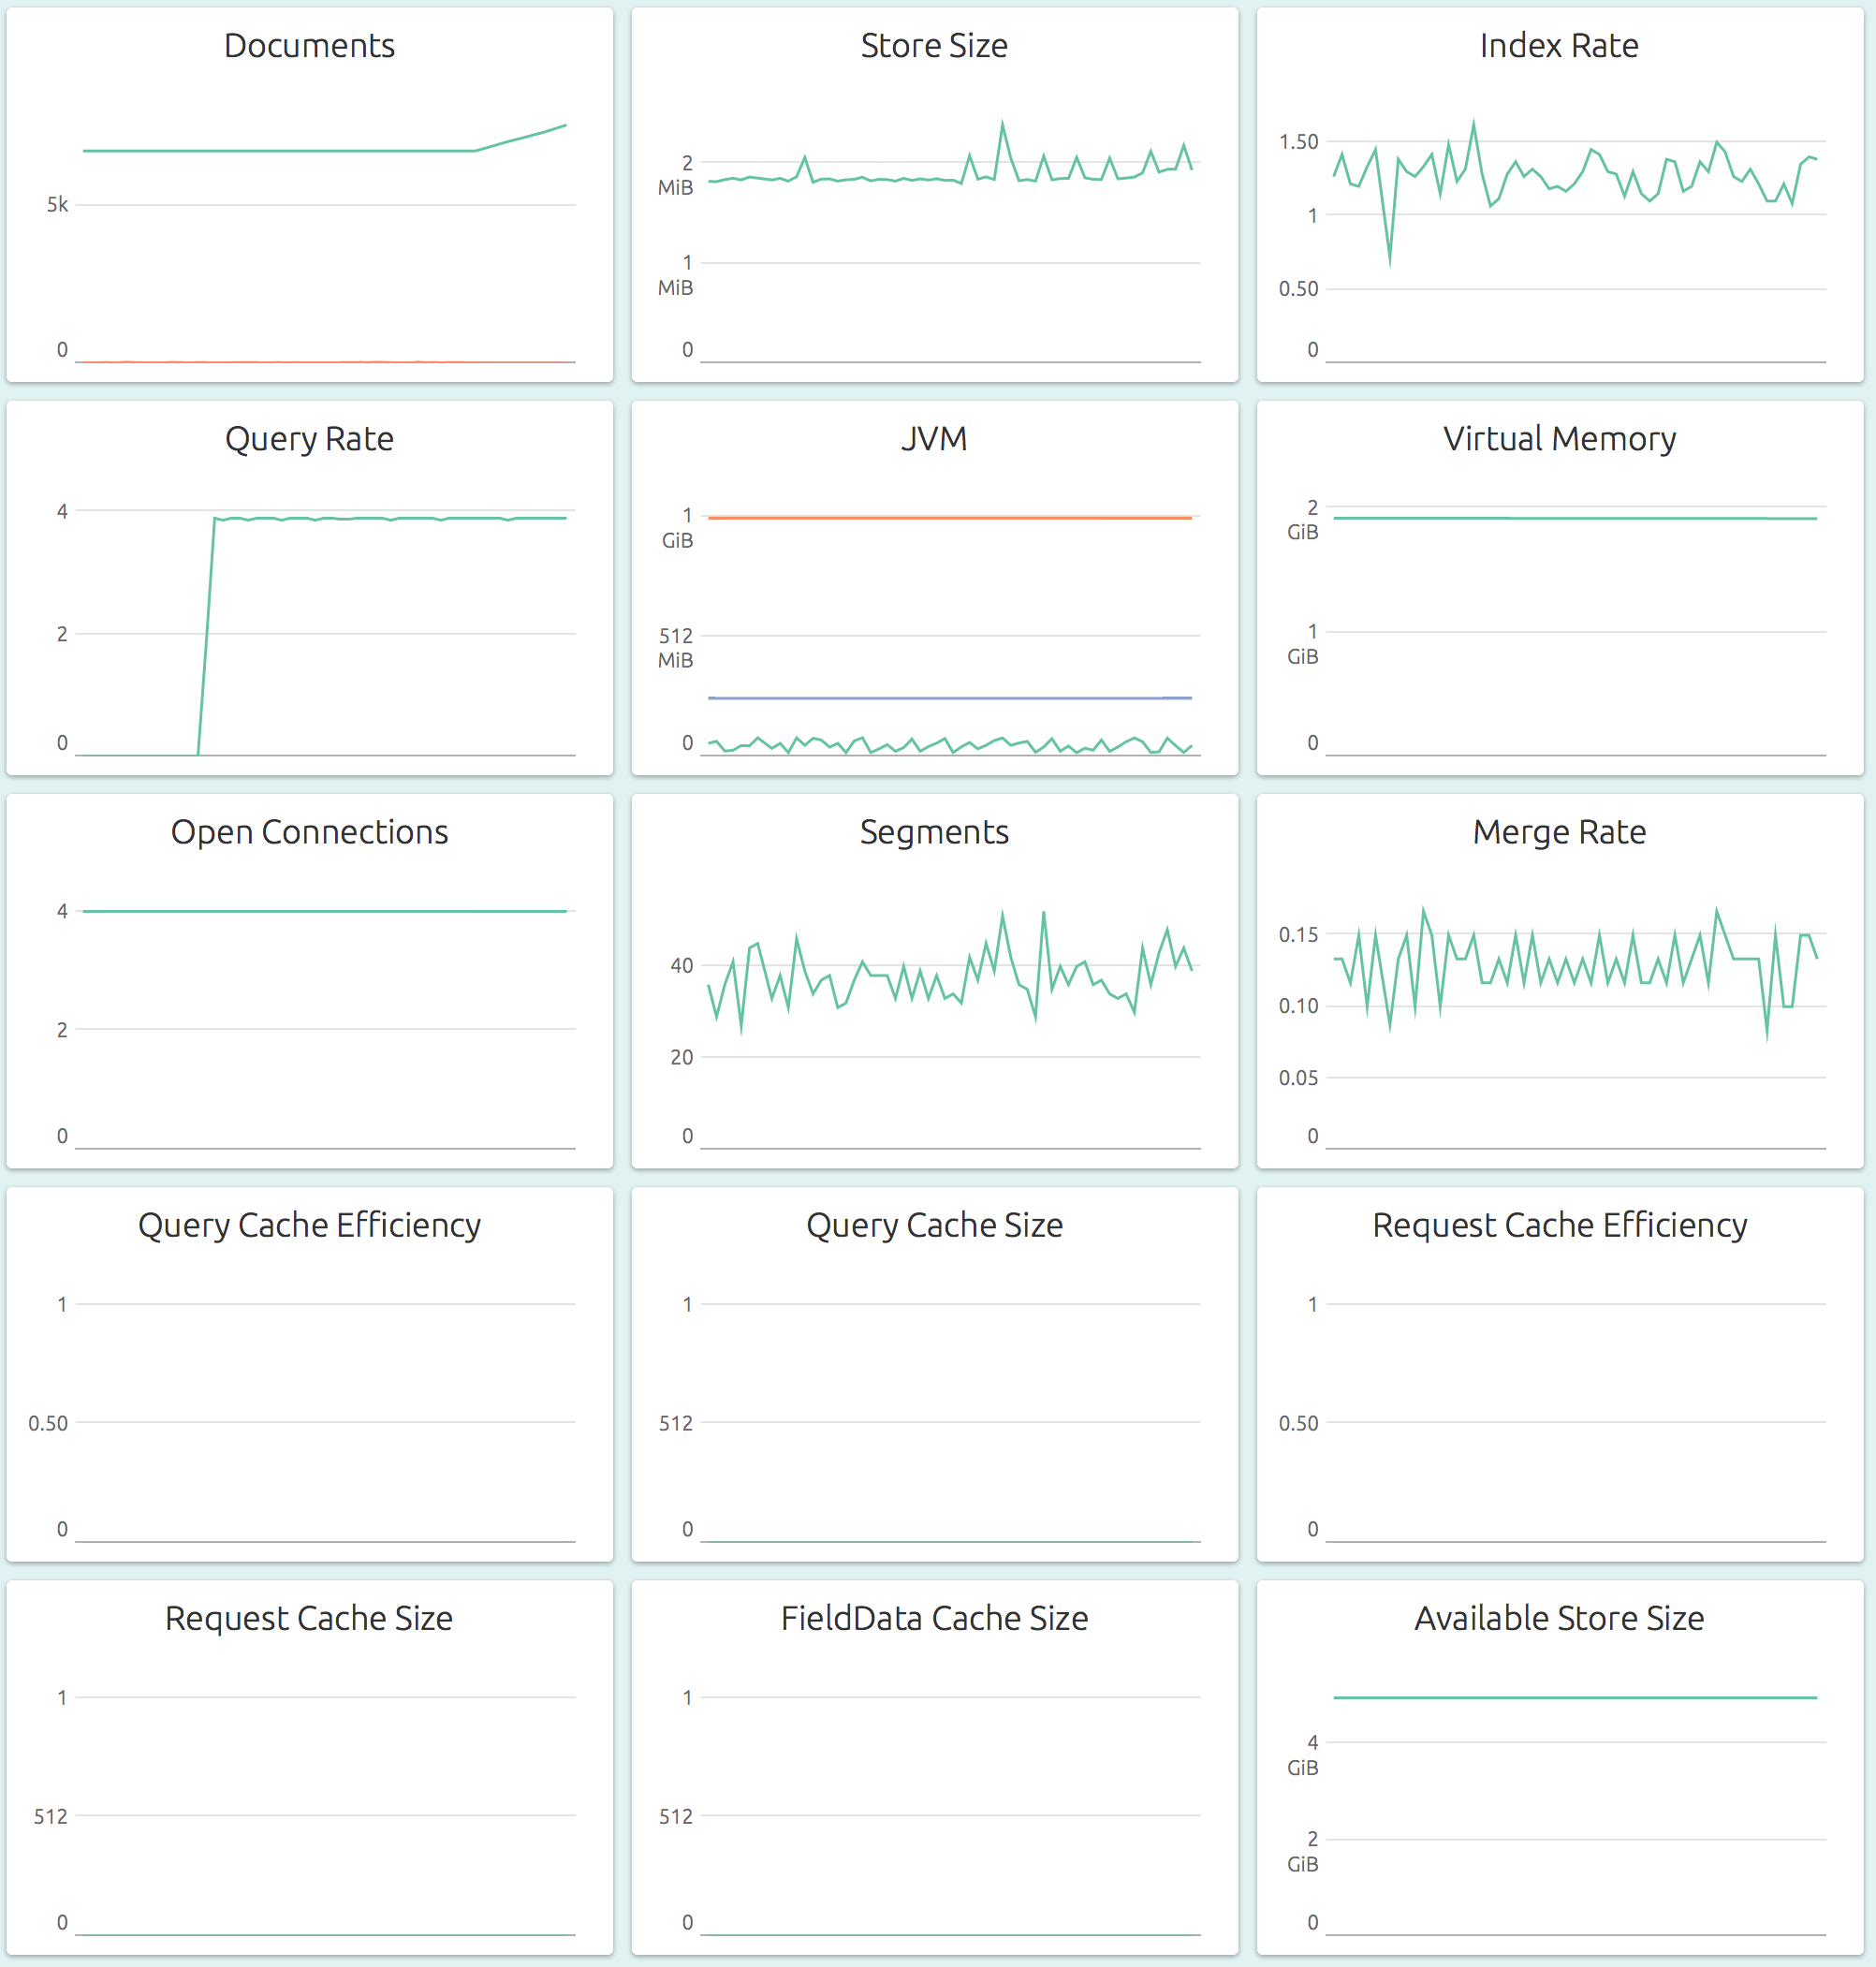
The graphs show numbers for a specified, single node of the cluster. At this level, both resource level (storage, memory, connections) and application level (index, merge, cache) graphs are available, which is what makes it the most informative dashboard to keep any eye on.
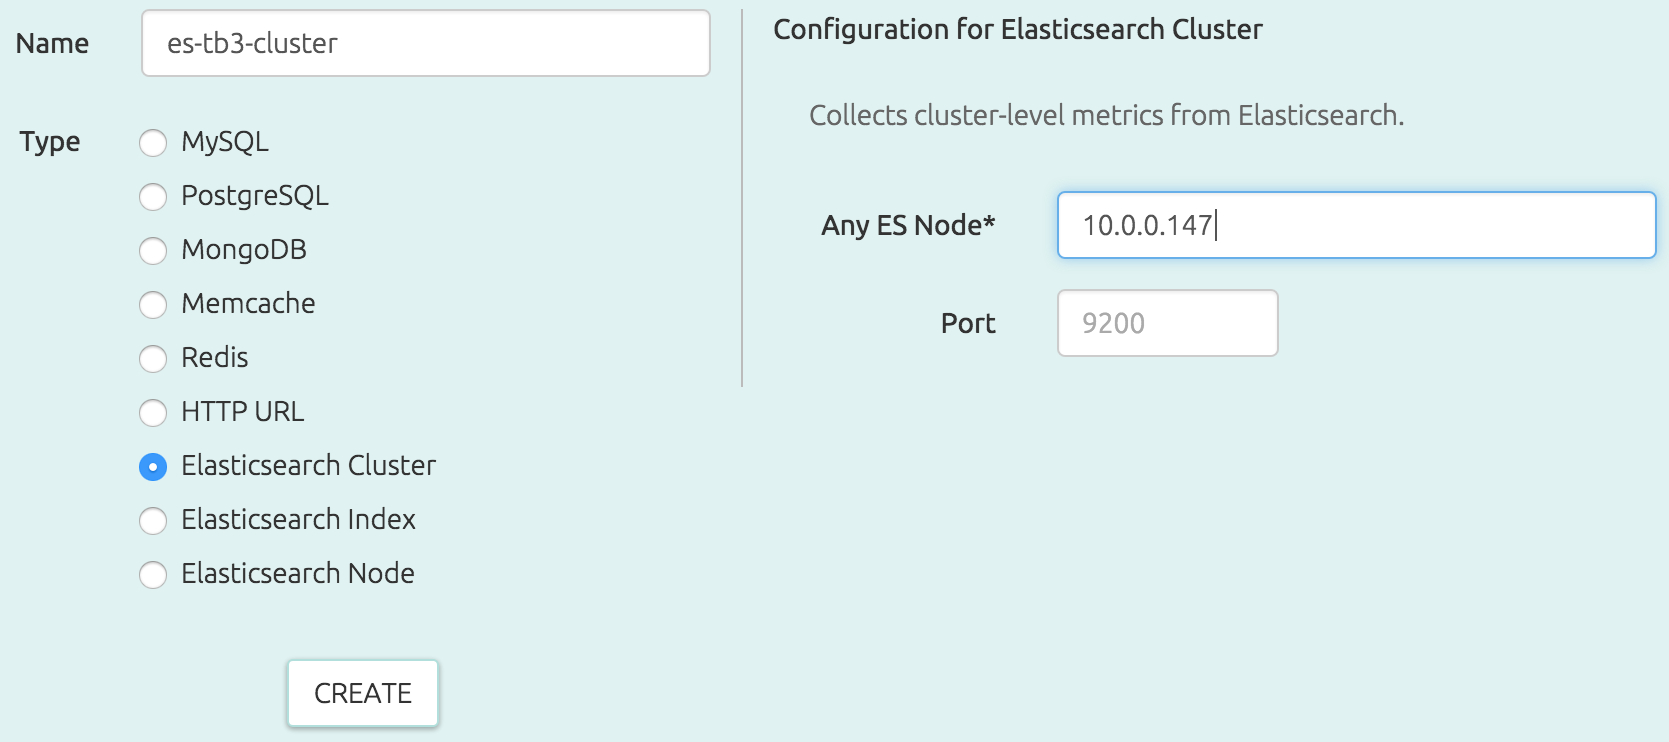
Easy Setup
OpsDash makes it really easy to start monitoring your Elasticsearch cluster – literally all you need to do is to punch in the IP address of any Elasticsearch node:
As usual, all metrics can be alerted upon, and notifications sent to Slack, HipChat, PagerDuty, Pushbullet or plain old (but non-spammy) email.
Start monitoring your Elasticsearch cluster today!