Apache Monitoring
With OpsDash, you can quickly start monitoring Apache, and get instant insight into key metrics. OpsDash dashboards come pre-configured, setup to monitor the most important Apache metrics. No messing around with individual metrics, figuring out which of them are important, no editing graph templates.
Apache log monitoring is included in the OpsDash agent. The agent will gather and report metrics like "Requests Per Second" and "Unique User Agents Per Second" from the access logs that it finds on the system, without any manual configuration. It can also gather and report metrics for individual virtual host log files that you specify.
Here’s how OpsDash’s curated dashboards come out of the box:
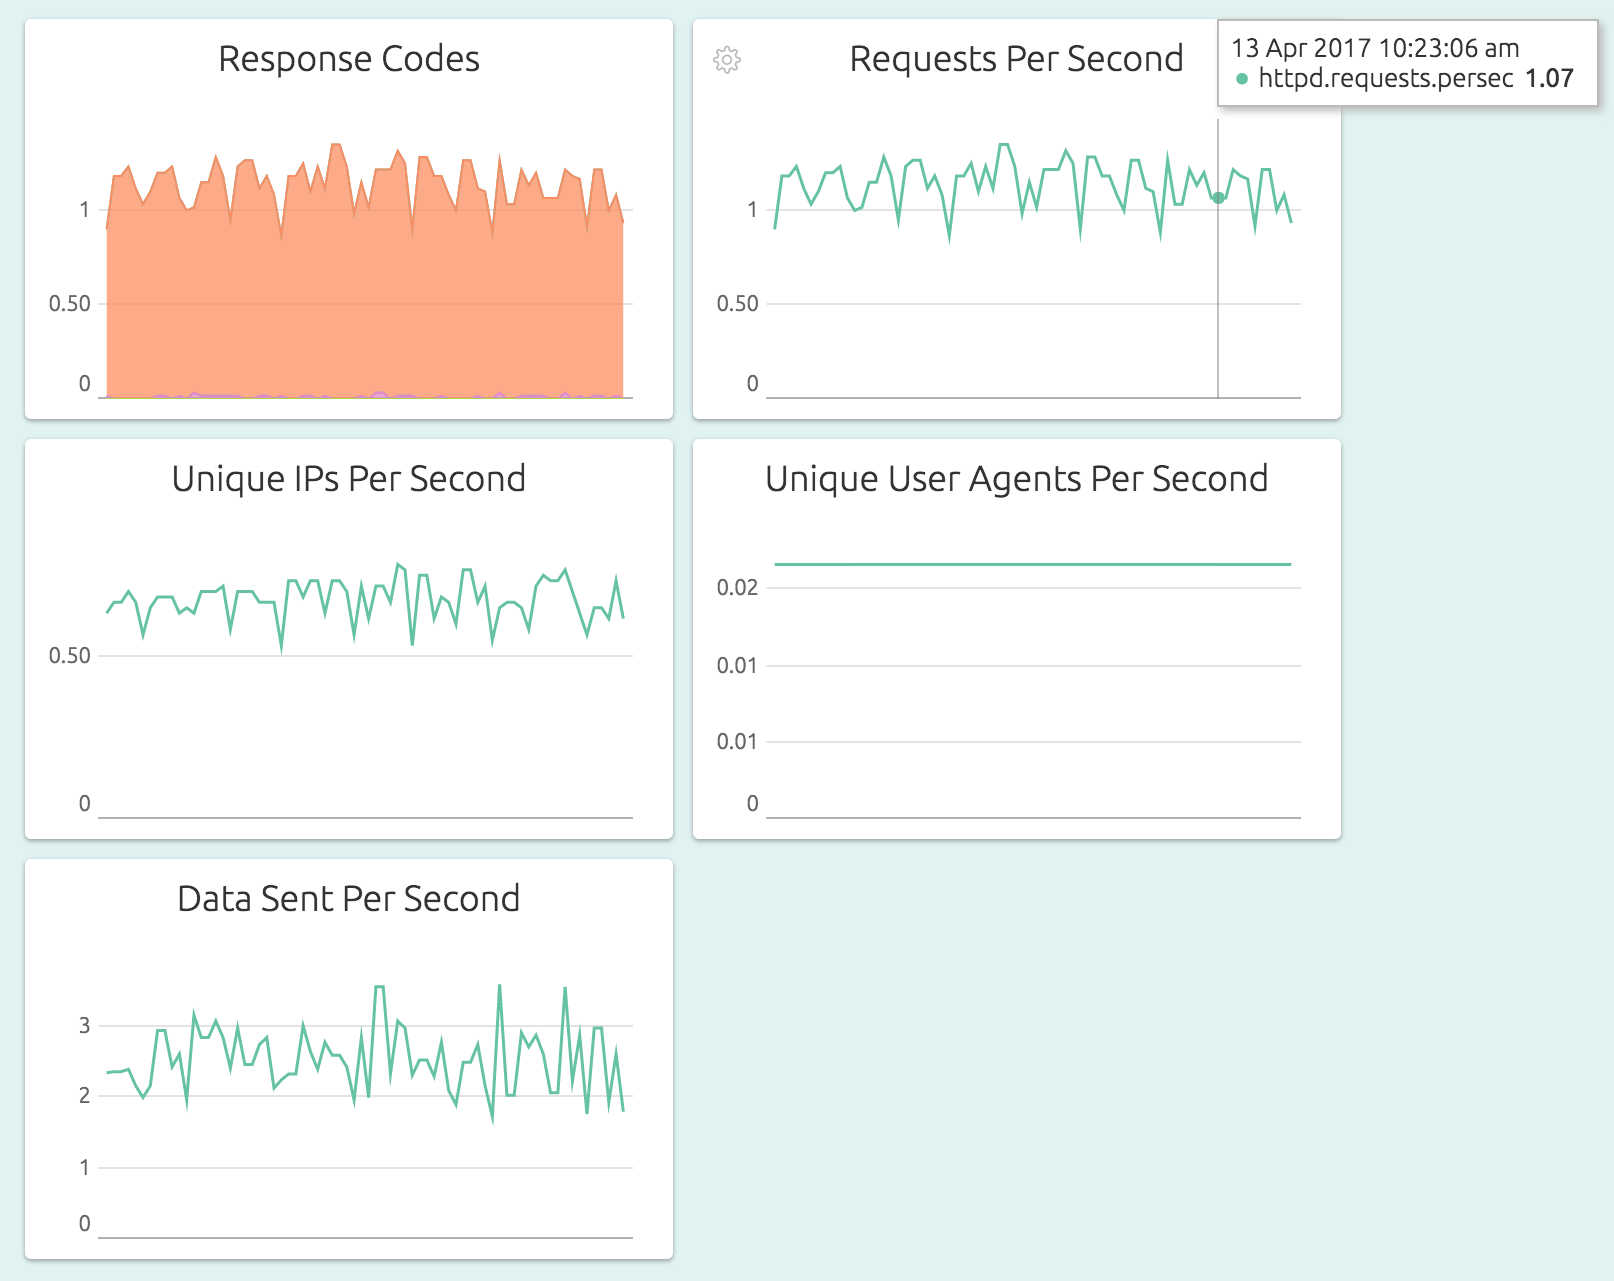
OpsDash Apache dashboard comes out the box with these graphs:
- Response Codes - The number of 2xx, 3xx, 4xx and 5xx response codes per second.
- Requests Per Second - The number of overall HTTP requests per second.
- Unique IPs Per Second - The number of unique IP addresses that hit the server each second.
- Unique User Agents Per Second - The number of unique user agent strings per second.
- Data Sent Per Second - The size of the HTTP response data sent each second, in bytes.
You’ll want to set warning and critical upper limits for these metrics so that you can identify and address emerging issues before they bite. You can quickly setup your alerts in OpsDash and send notifications by Slack, Hipchat, OpsGenie, PagerDuty or Email.
New here?
OpsDash is a comprehensive solution for server monitoring, service monitoring, database monitoring and application metrics monitoring. You can use OpsDash for monitoring MySQL, PostgreSQL, MongoDB, memcache, Redis, Apache, Nginx, Elasticsearch and more. It provides intelligent, customizable dashboards and spam-free alerting via email, HipChat, Slack, PagerDuty, OpsGenie, VictorOps and Webhooks. Send in your custom metrics with StatsD and Graphite interfaces built into each agent.