With OpsDash, you can quickly start monitoring your PostgreSQL servers, and get instant insight into key performance and health metrics like Transactions per Second, Replication Lag, Block Cache Efficiency and more.
Quick Start
Add your PostgreSQL instance as a new service to be monitored in OpsDash:
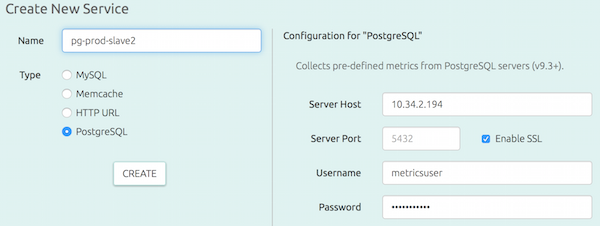
Hit “Create” and you’re done!
Within minutes, and without any further fiddling, you will be able to see a dashboard like this:
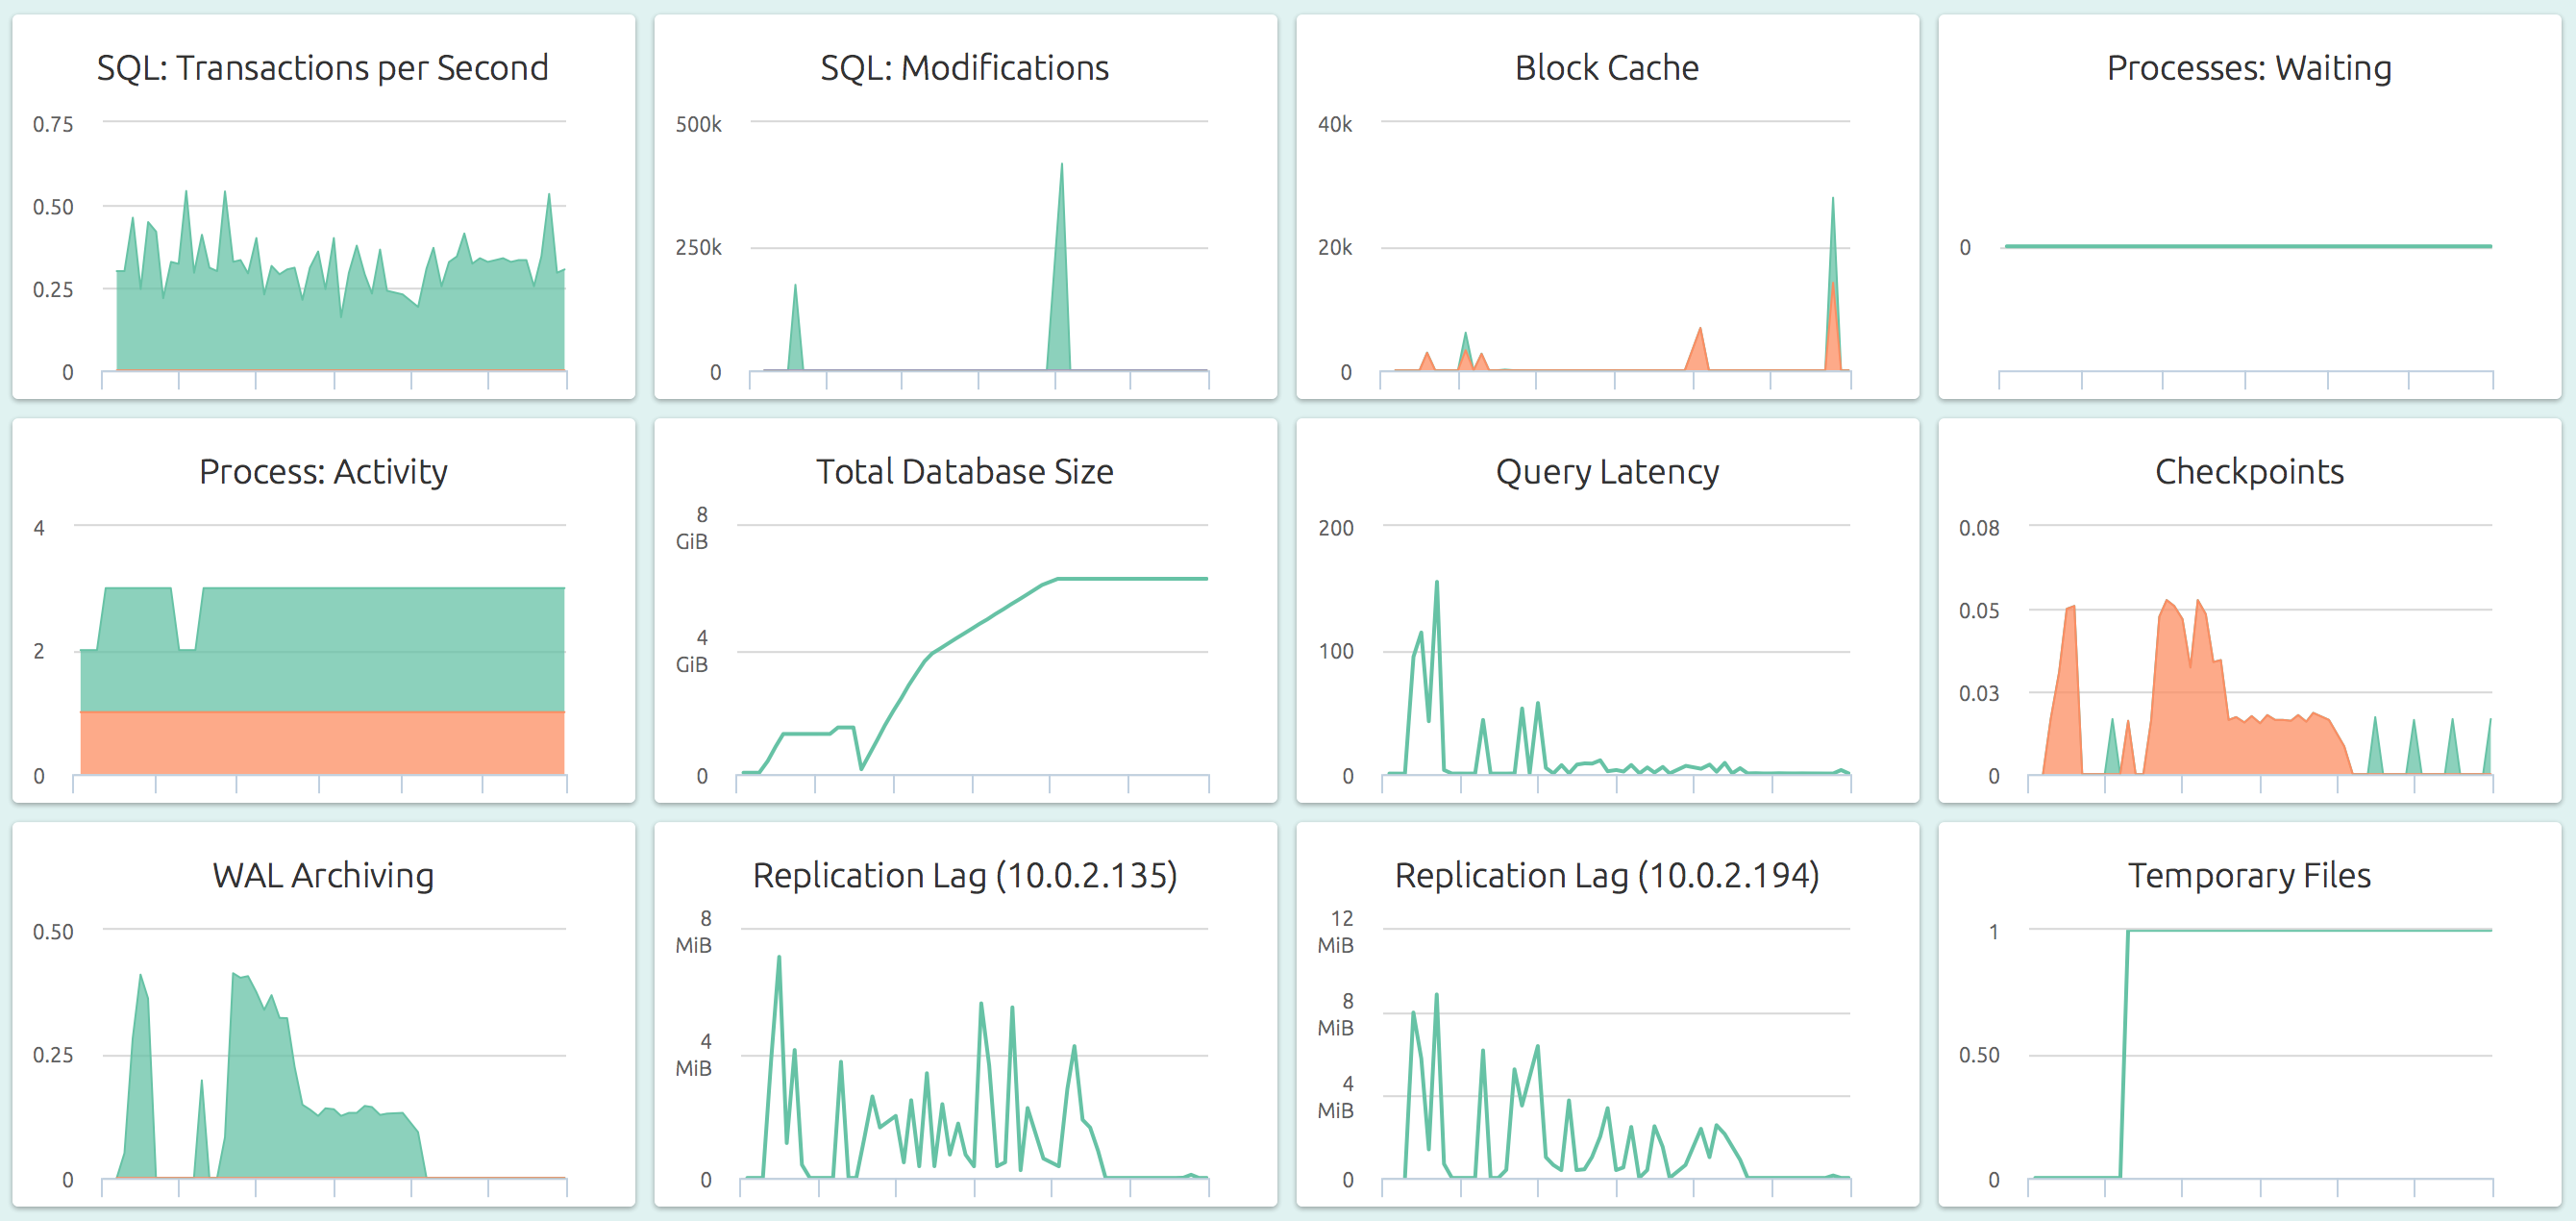
OpsDash strives to save you the tedious work of setting up a useful dashboard. The metrics you see here were carefully chosen to represent the most relevant health and performance indicators for a typical PostgreSQL instance.
PostgreSQL Replication Monitoring
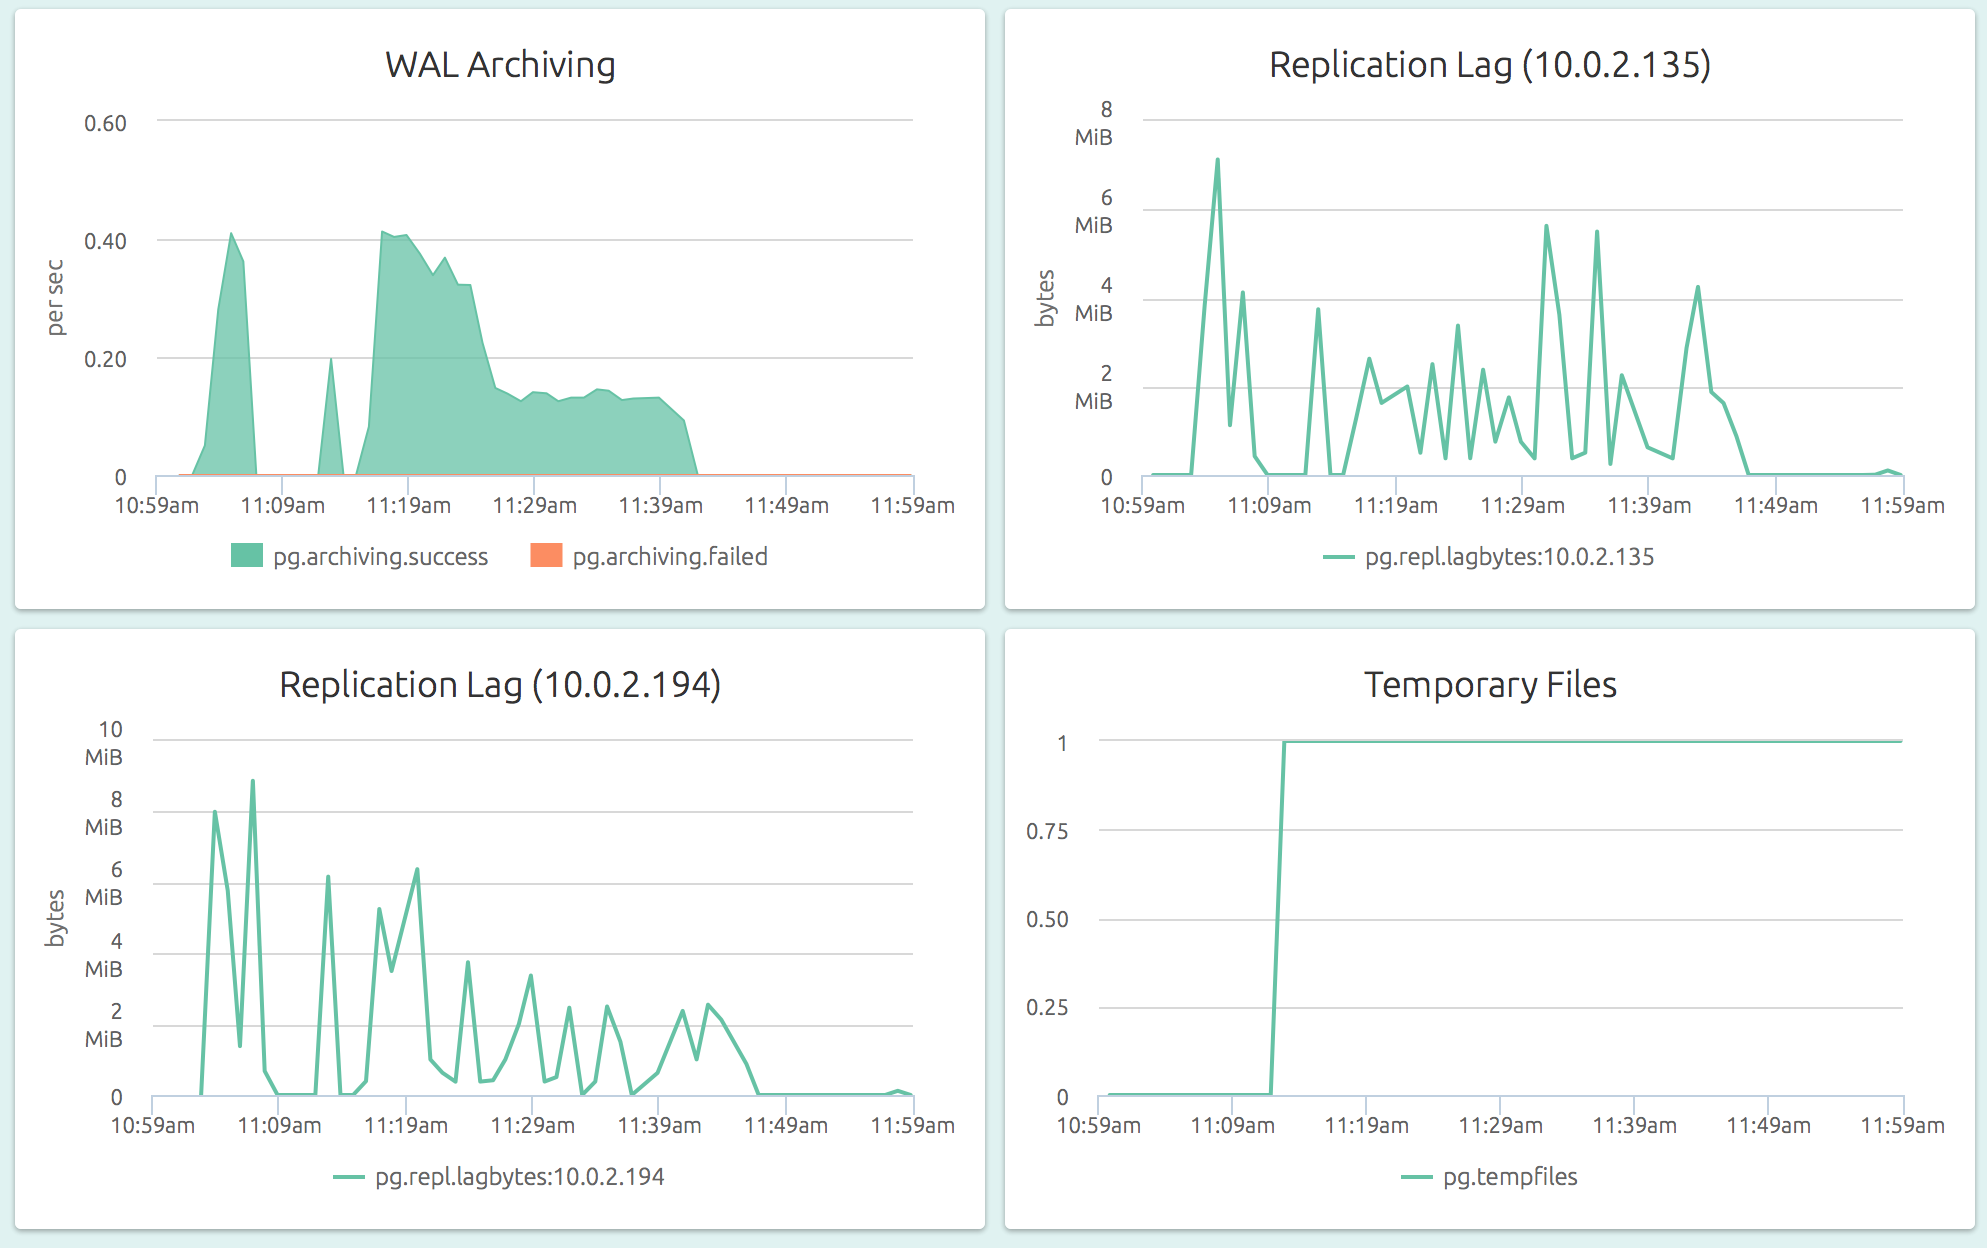
OpsDash understands the streaming replication feature of PostgreSQL and displays per-slave replication status on the master:
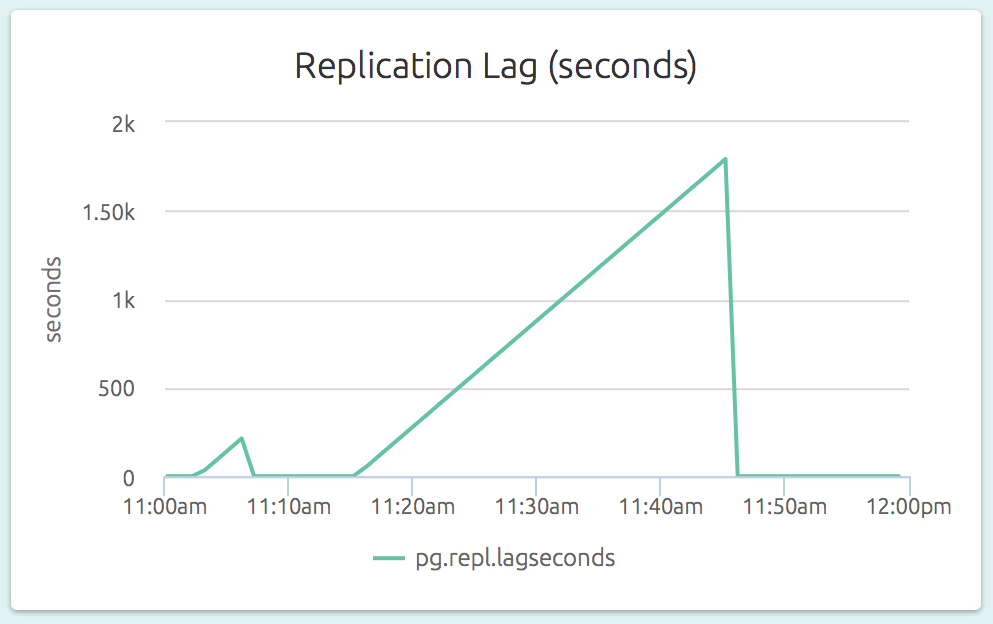
The replication lag (as a length of time) is also visible on a slave’s dashboard. In the graph below (part of the dashboard of a slave), we can see that the slave could not catch up to the master’s changes for a while.
By comparing the replication lag at master side (was the master able to ship the WALs in time?) and the slave side (was the slave able to apply the incoming WALs in time?), it is easy to identify the replication bottleneck.
Adding a threshold-based alert to the replication lag metric on a slave is a quick and easy way to catch a lagging slave before it gets out of control.