Easy To Deploy
The OpsDash Server comes packaged in deb, rpm or tar.gz formats. In addition, we also host apt and yum repositories, so you can install and upgrade using standard package manager commands.
We’re serious about making this simple! No package dependencies, no plugins to install, no template required, no complex language to master. From initial installation to upgrade, working with OpsDash for server monitoring is a breeze.
Lightweight Agent
You can install the agent and be up and running with OpsDash server monitoring in a matter of minutes. The agent is also available in rpm, deb, tar.gz packages as well as from our apt and yum repositories.
The agent is a zero-dependency Go-based single-binary executable that is very light on resources.
The agent discovers disks and network interfaces by itself. No configuration required. Adding or removing disks does not require a reload or restart of the agent.
Services and Databases
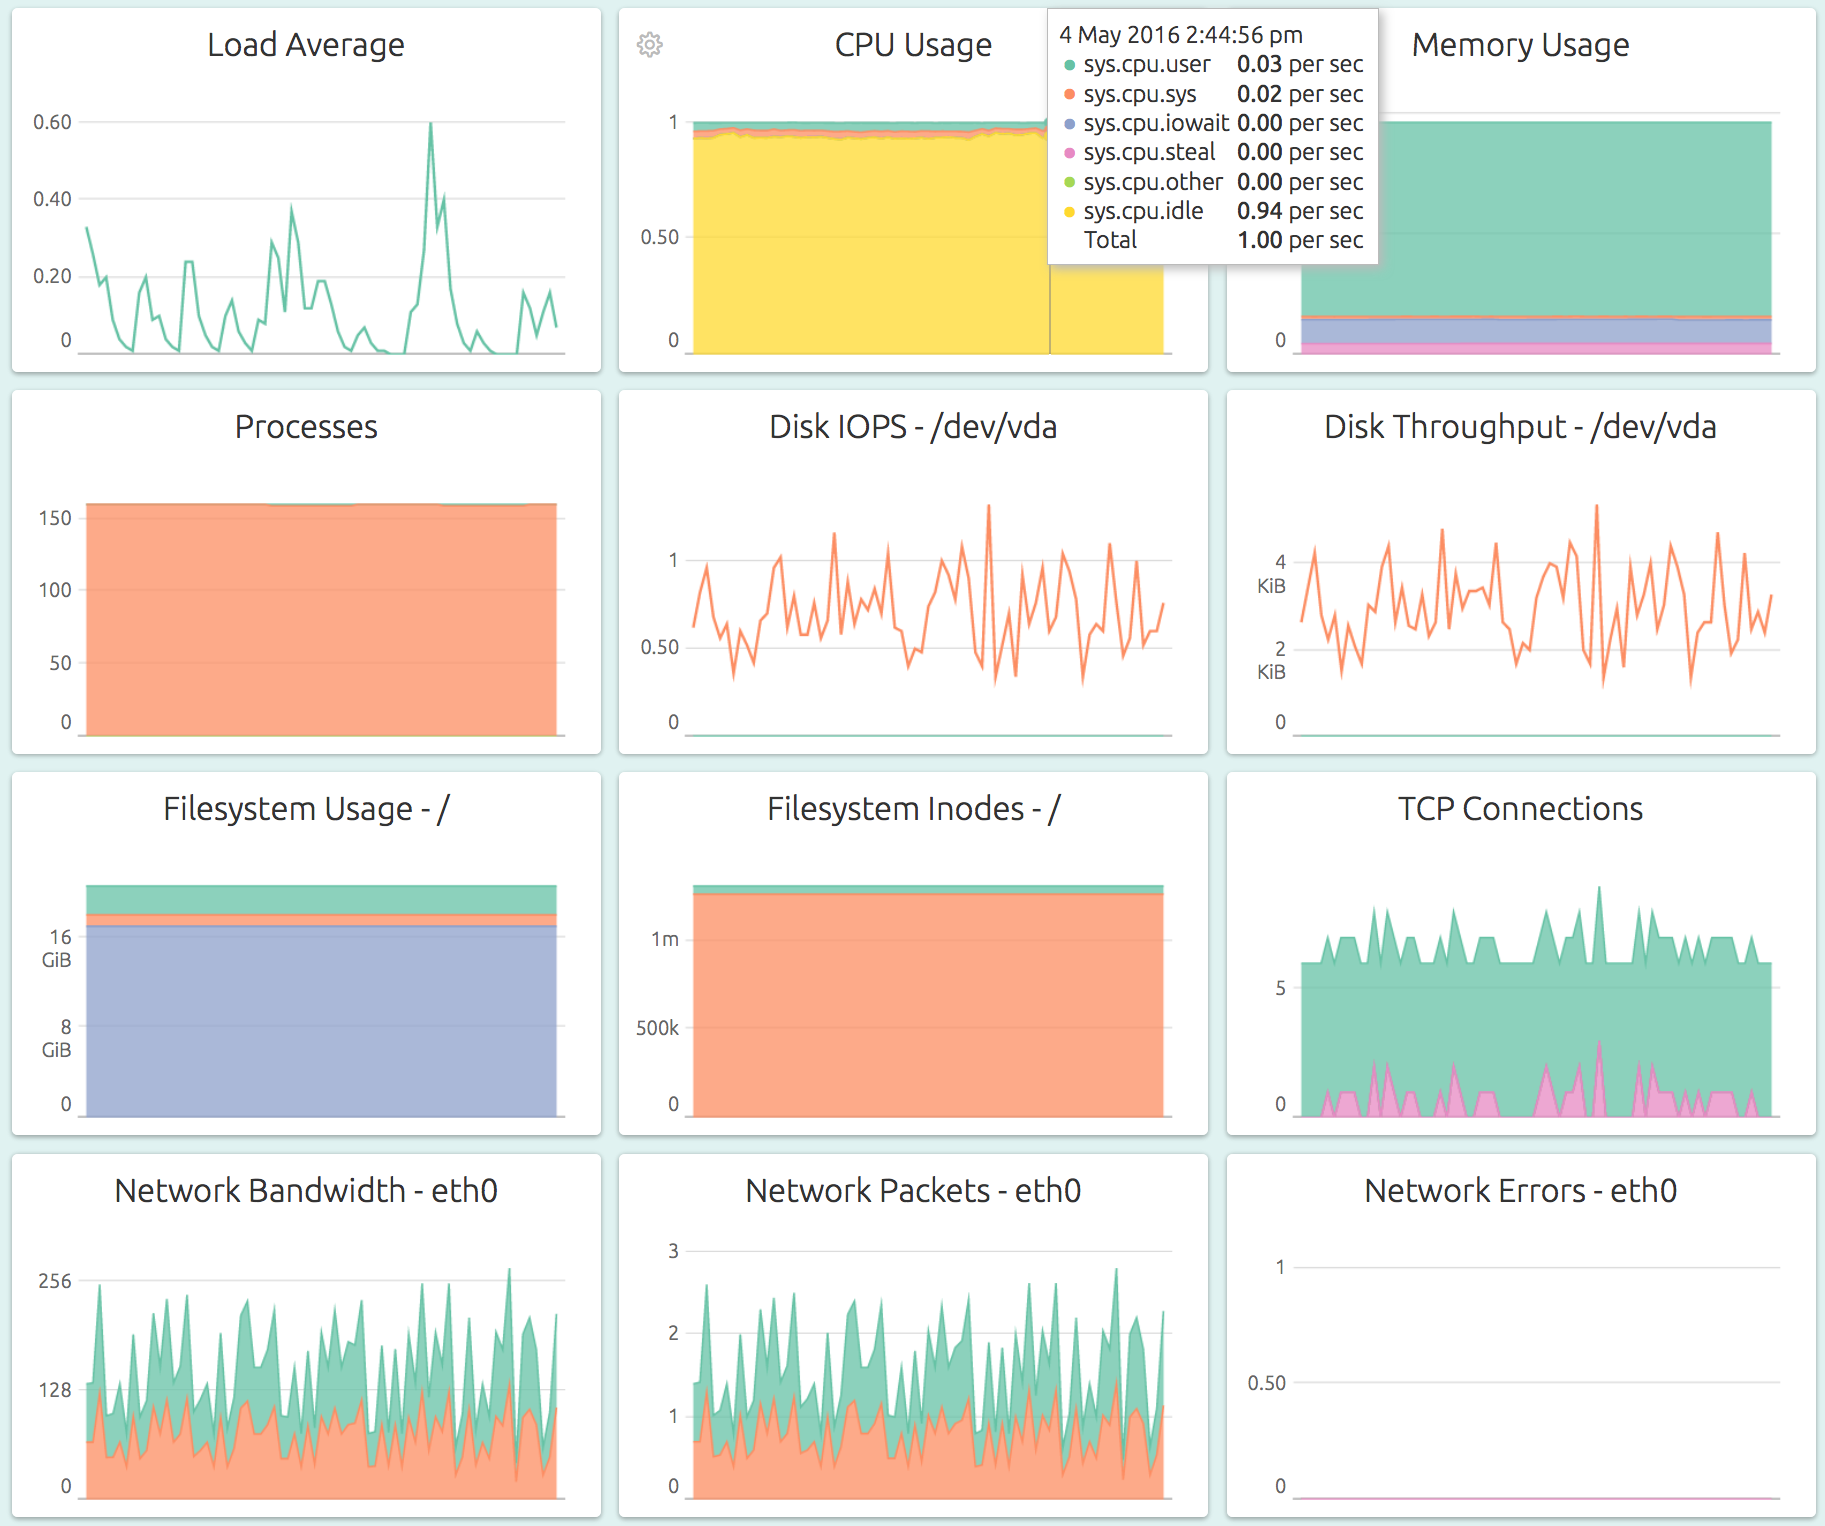
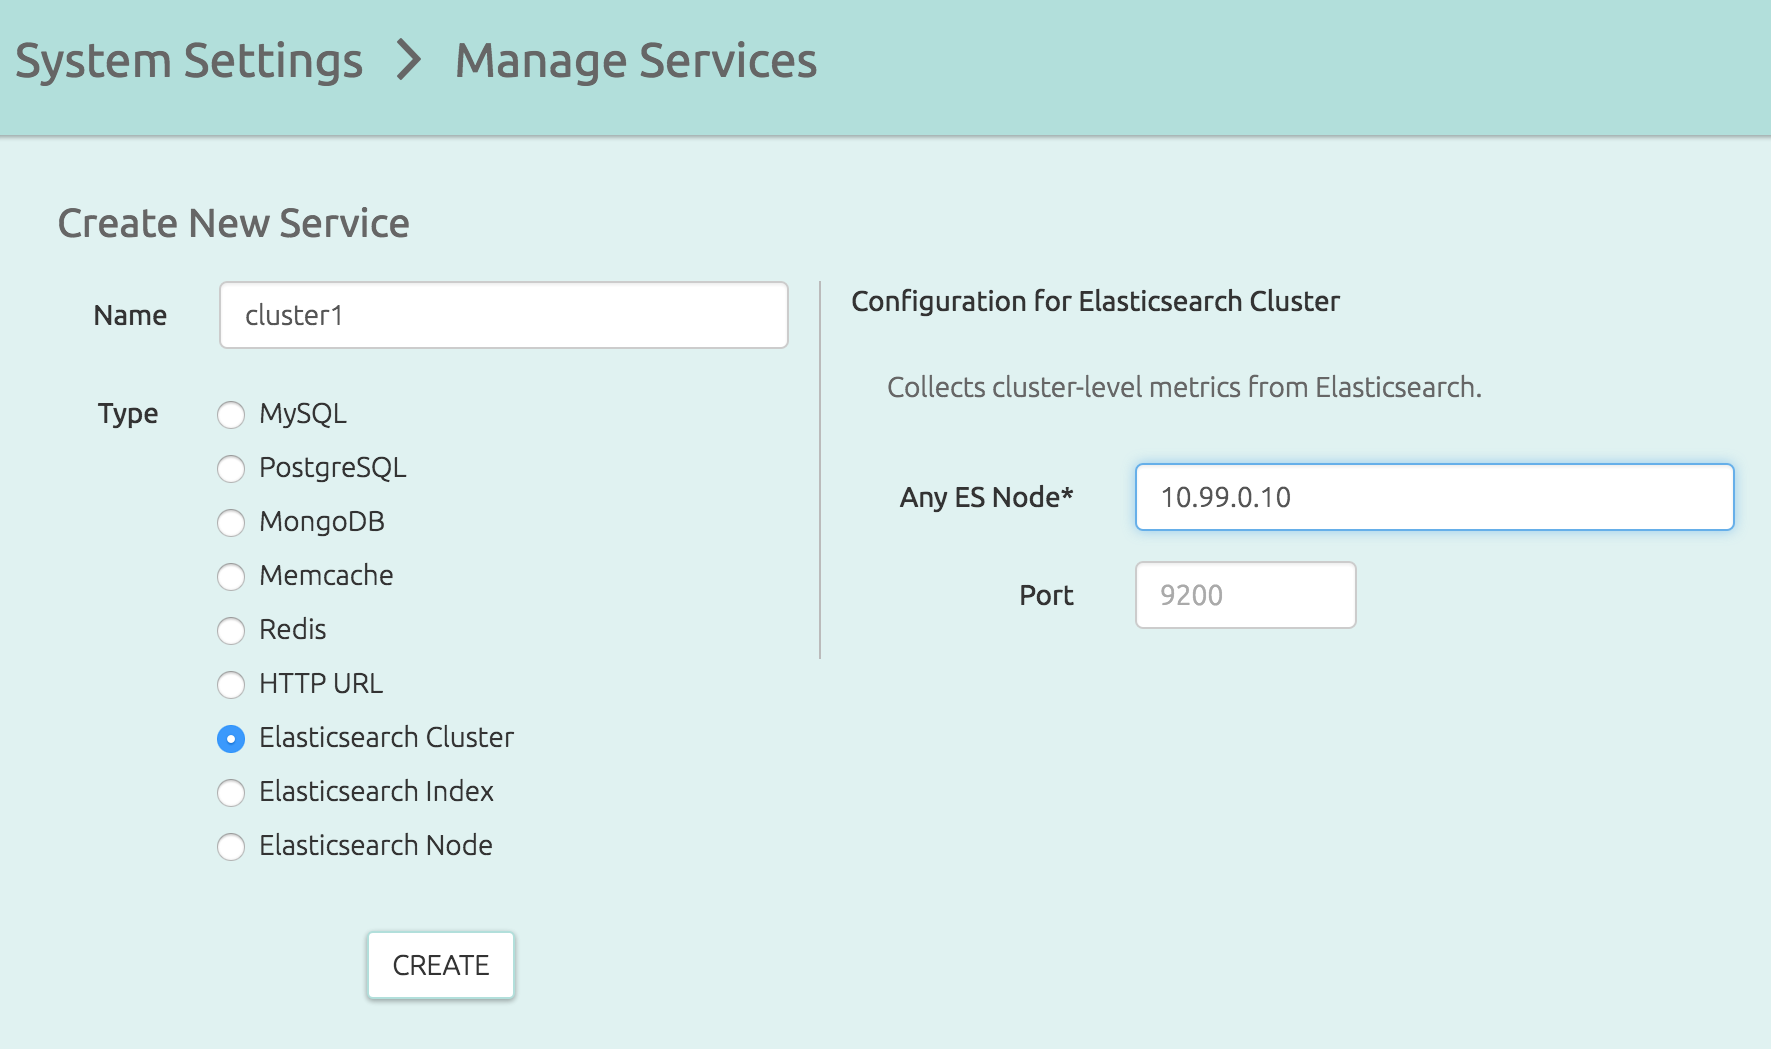
Easily configure services and databases to be monitored, directly from the UI. For each service or database you monitor, OpsDash automatically sets up monitoring dashboards that bring out the most important health and performance metrics. No configuration, no templates. You can of course, customize the dashboards, or design your own, if you like.
Alerts & Notification
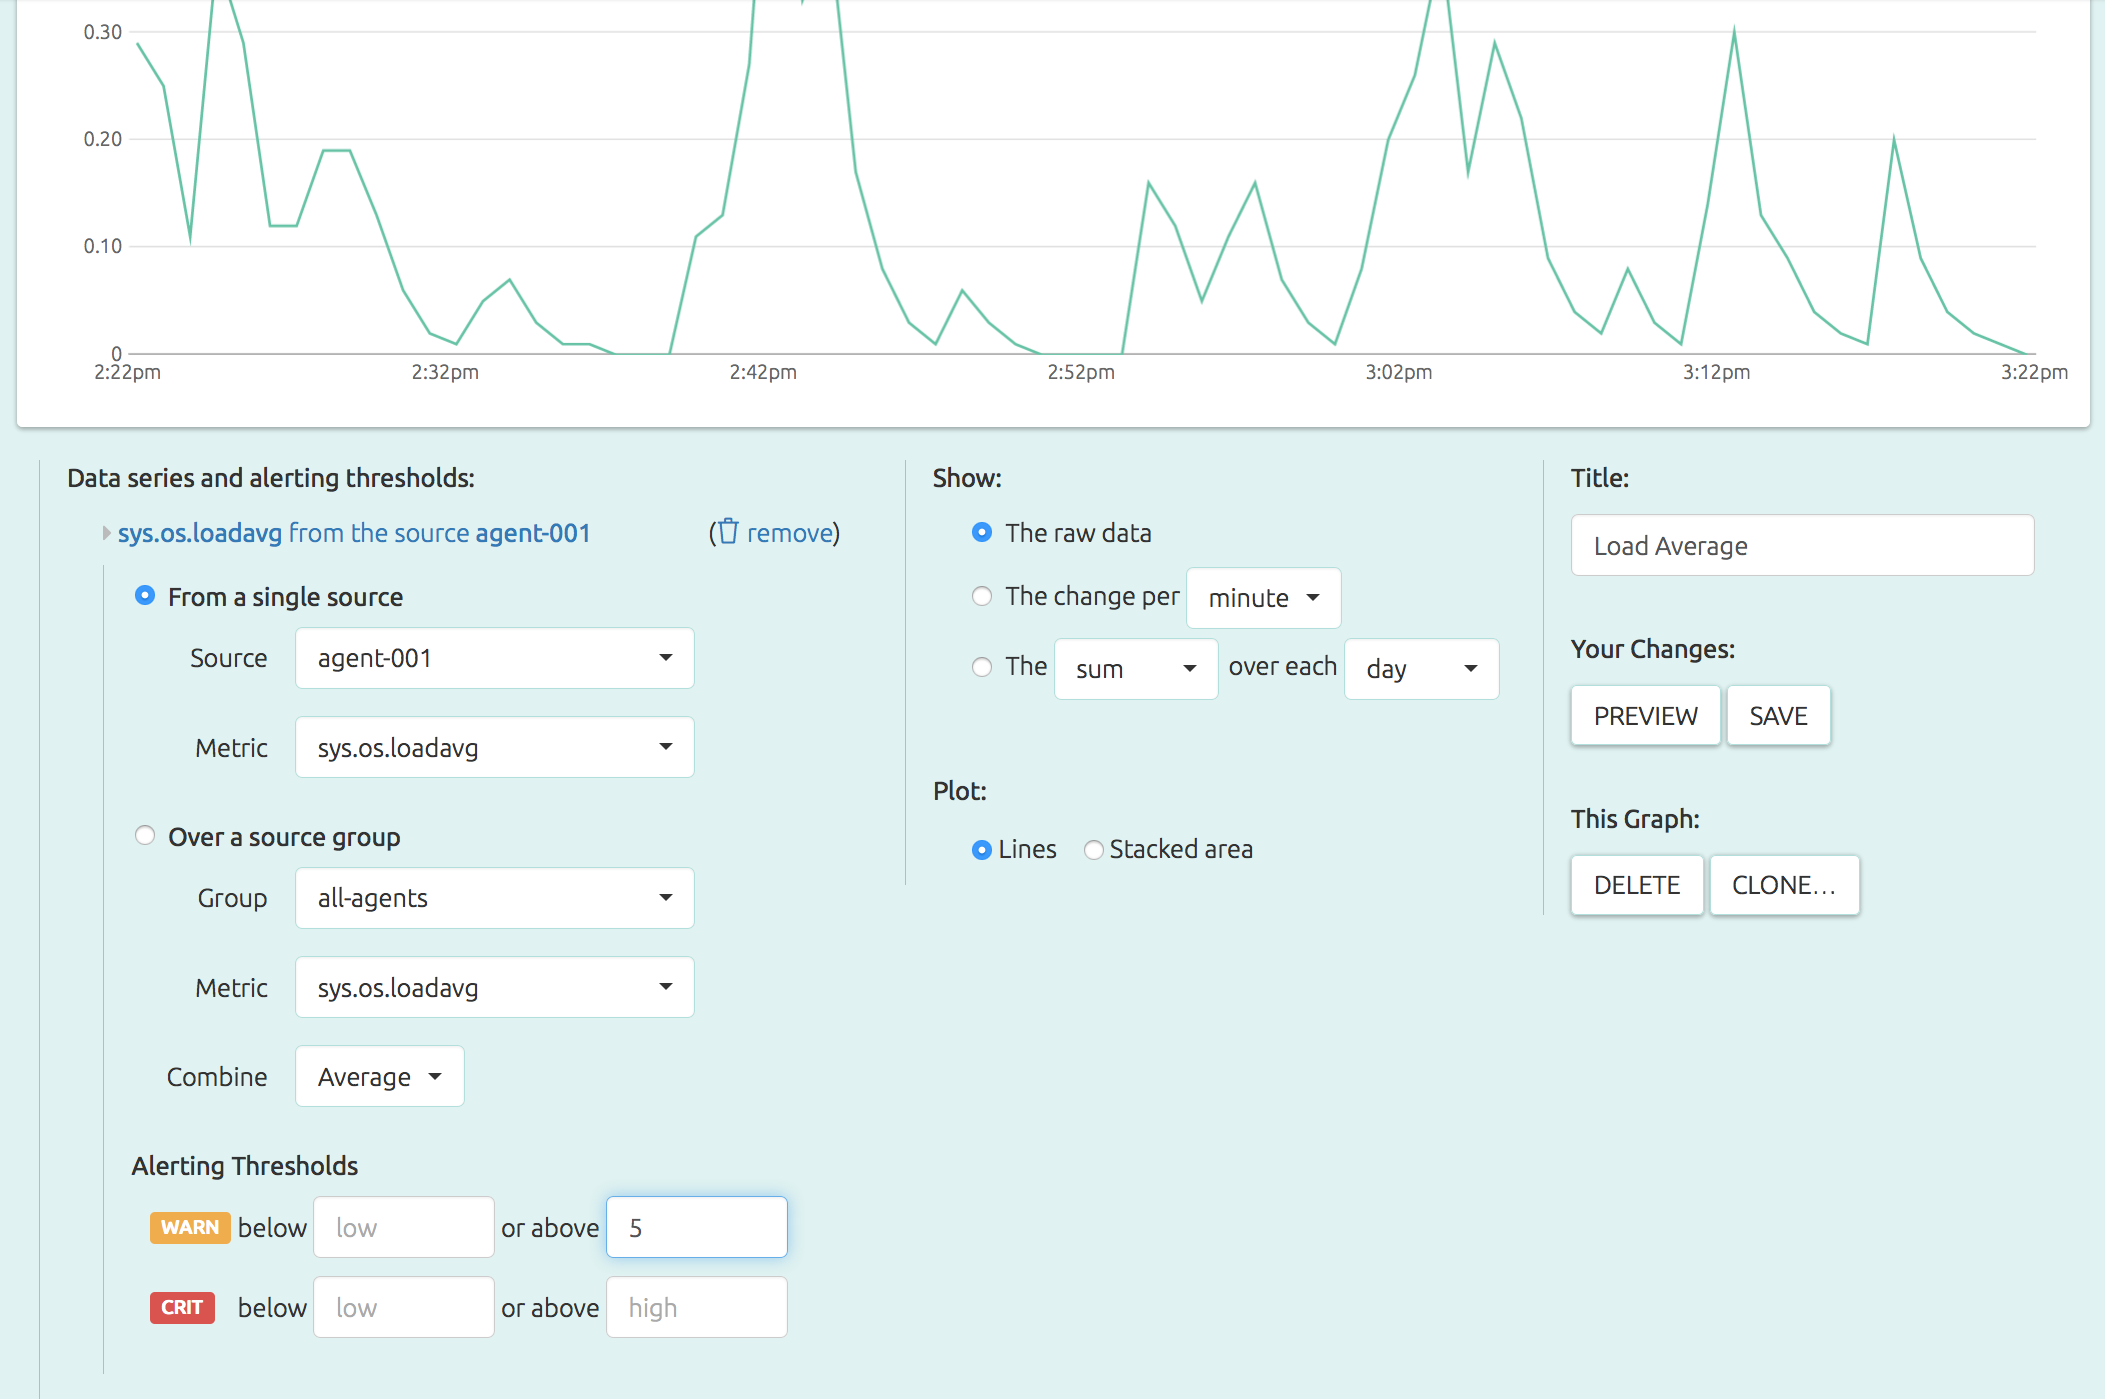
You can easily set alerts for upper and lower limits any metric. Both critical and warning limits can be set. Just click on the graph in your OpsDash dashboard, and enter the appropriate values under alert settings. Notifications can easily be set up to be sent out via email, Slack, HipChat, Mattermost, PagerDuty, OpsGenie and VictorOps.