OpsDash
OpsDash is an affordable server monitoring, service monitoring, database monitoring, uptime monitoring, dashboarding and alerting solution.
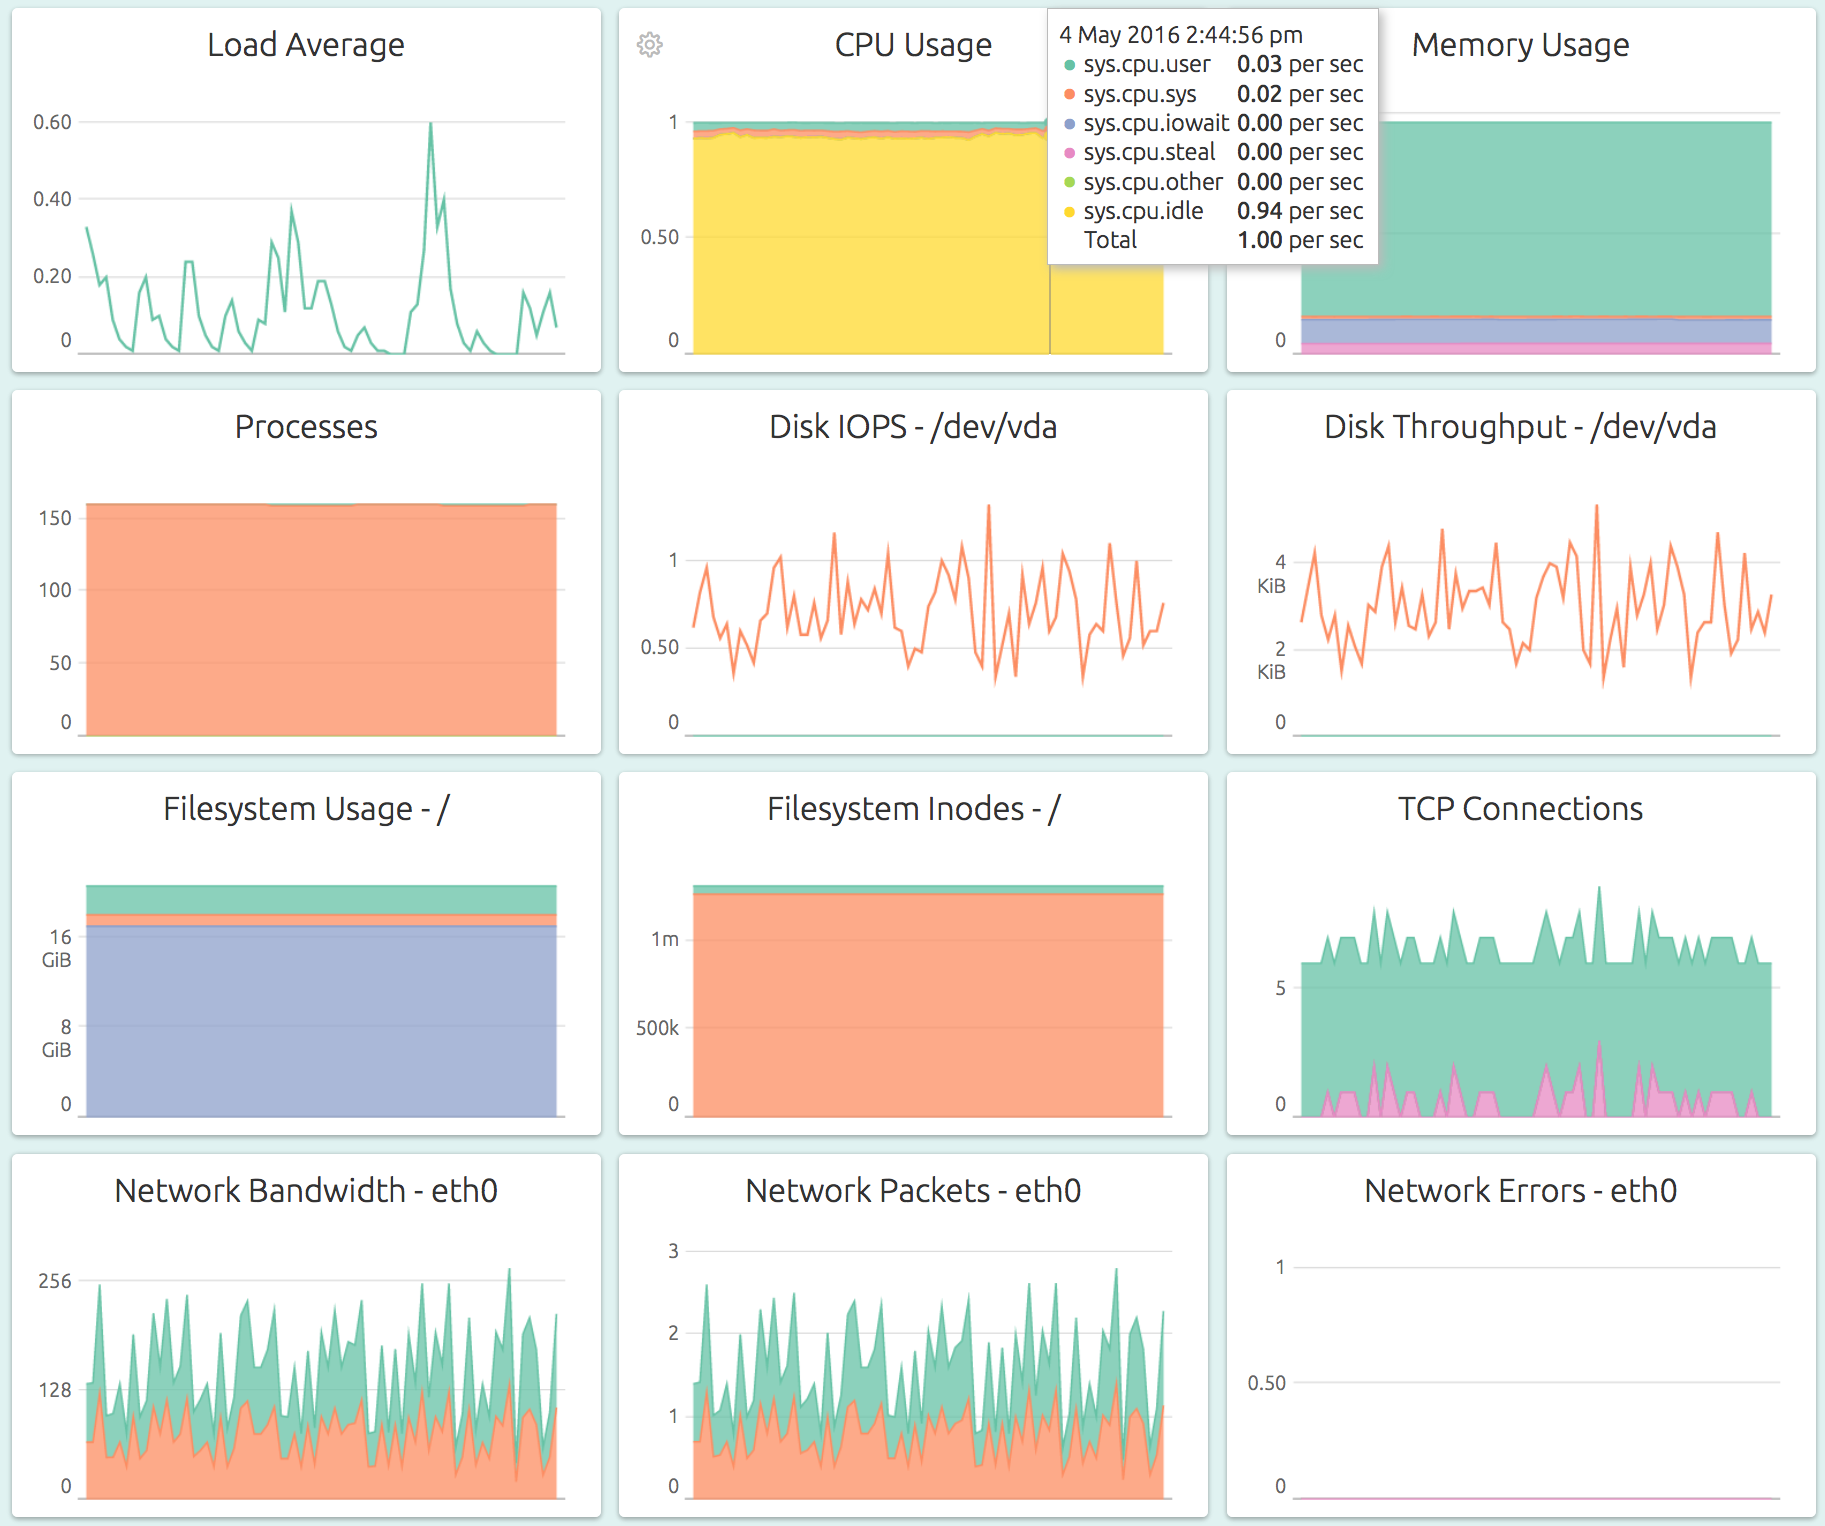
- Beautiful dashboards with key metrics automatically configured for many services including MySQL, PostgreSQL, MongoDB, Elasticsearch, Memcached, Redis, Apache, Nginx and Docker.
- Set alert thresholds easily. Take advantage of rule-based notification routing and integration with Slack, HipChat, Emails, PagerDuty, OpsGenie, VictorOps and Webhooks.
- Uptime monitoring lets you track responsiveness of public HTTP and HTTPS URLs from multiple locations around the globe each minute. TLS certificate expiry tracking included.
- Lean, mean and easy to deploy.

New Relic
New Relic’s strength is application performance monitoring.
- Known for excellent APM - giving you code level visibility to achieve optimal performance in production environments.
- Infrastructure monitoring becomes costly quickly, especially for larger servers.
- Plugins may be difficult to work with, requiring scripting in various languages, and there is limited support for custom metrics.
The Bottom Line
For optimal results, use both together. New Relic is a leader in application performance management. Use it to optimize your code for maximum performance. To ensure your infrastructure is rock solid, use OpsDash for server monitoring, service monitoring, database monitoring, uptime monitoring and alerting.
Try OpsDash Today!
Monitor your servers, services and databases
Looking for self-hosted? Sign up here.