OpsDash now supports monitoring MongoDB. You can quickly start monitoring your MongoDB instances without having to install plugins or agents. OpsDash provides a well-thought-out dashboard that displays metrics that are most relevant to the health and performance of the MongoDB instances being monitored.
Quick Start
Add your MongoDB instance as a new service to be monitored in OpsDash:
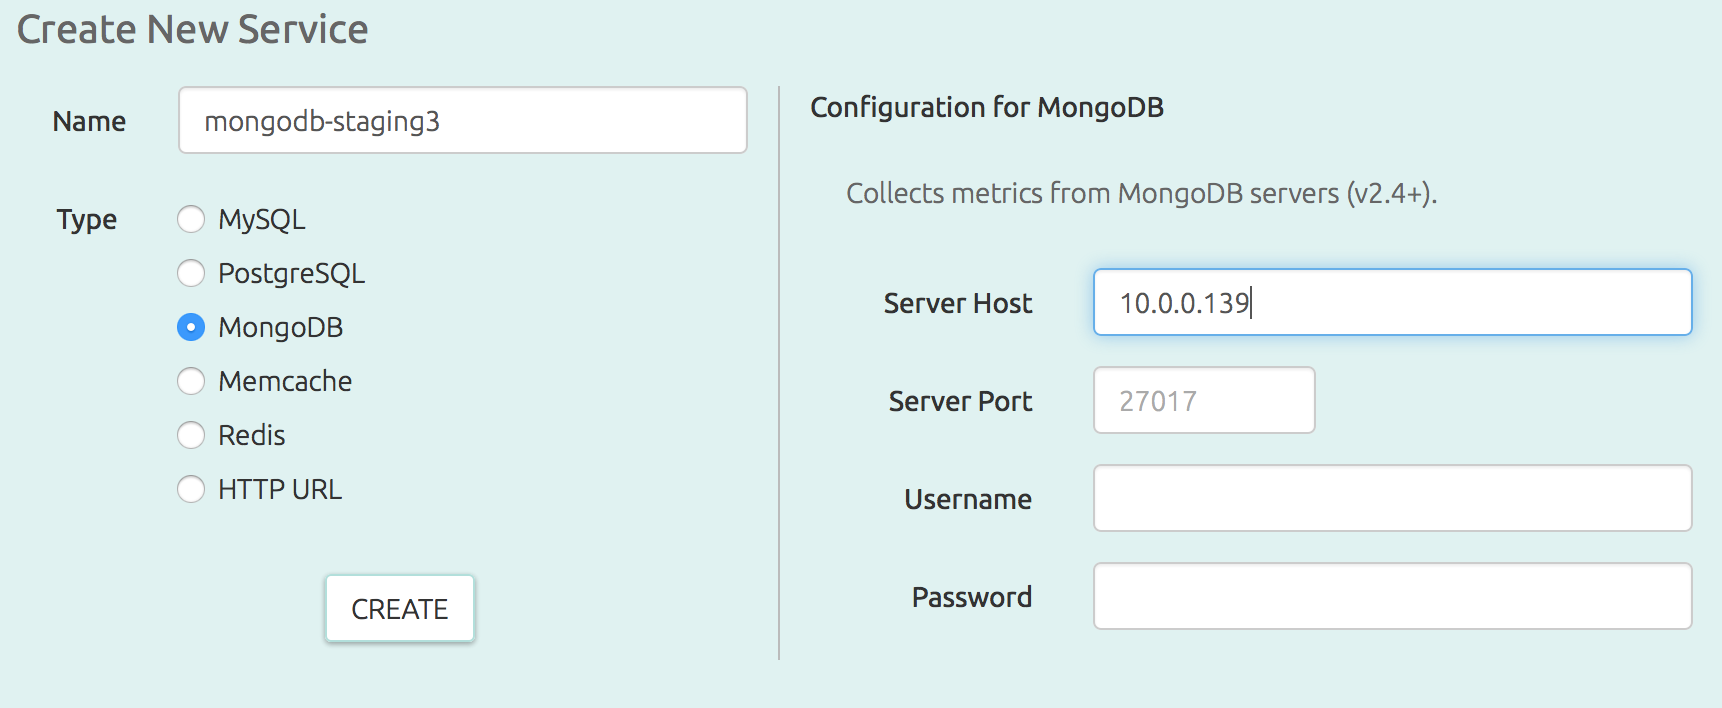
You can specify a username and password if the database requires authentication.
Hit “Create” and you’re done!
Within minutes, and without any further fiddling, you will be able to see a dashboard like this:
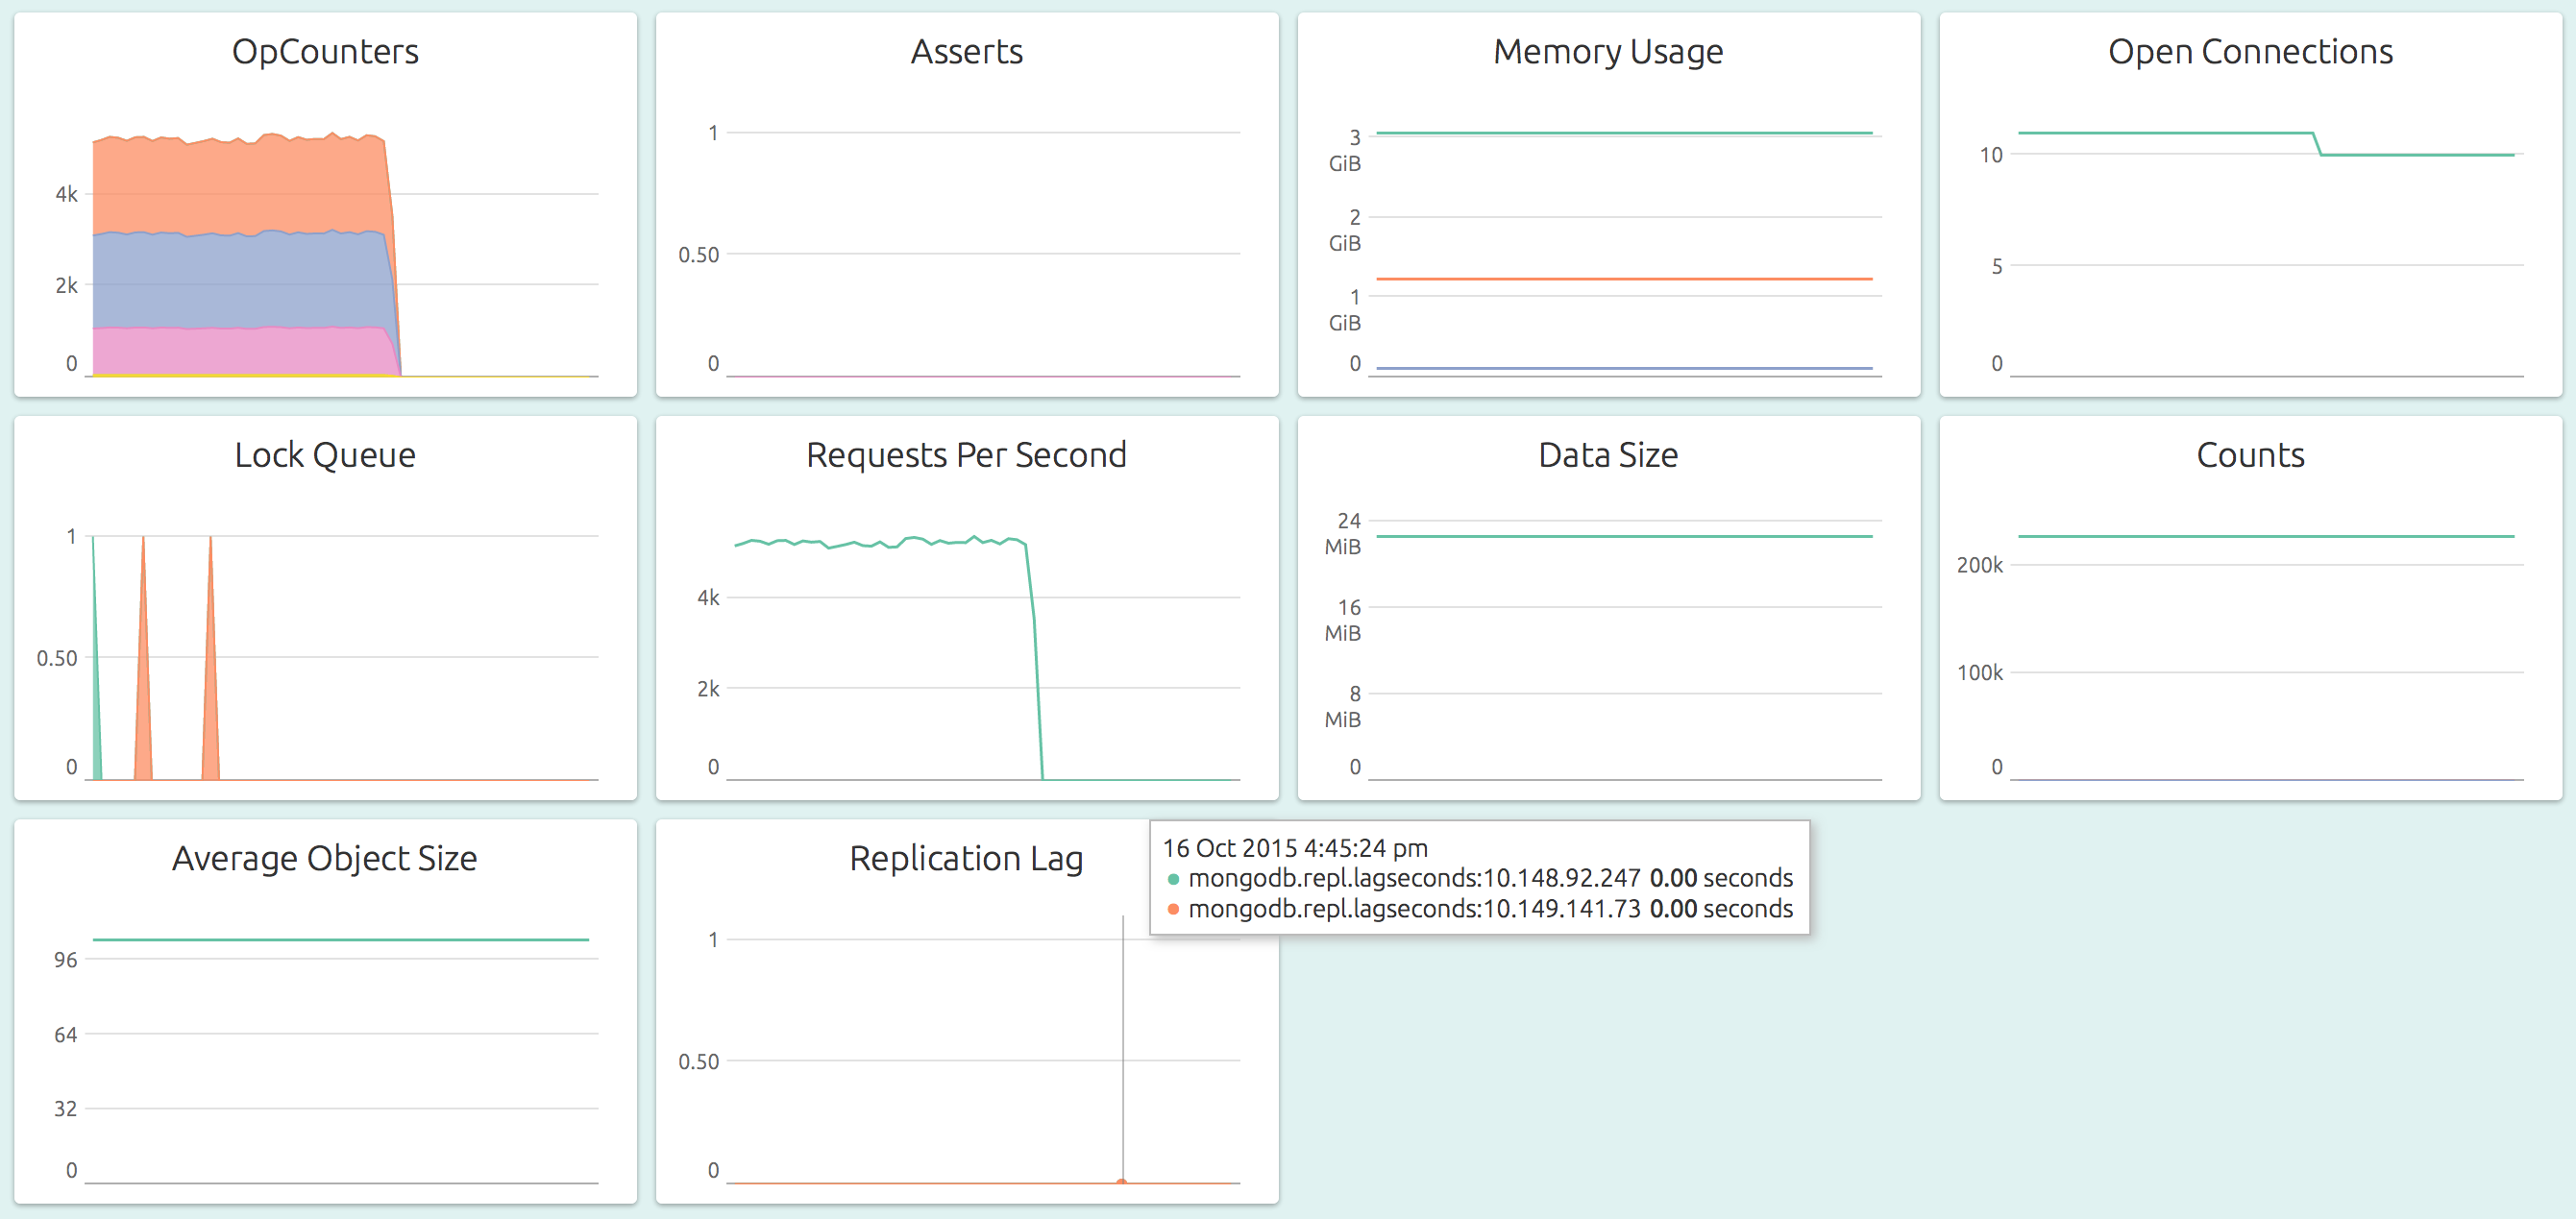
OpsDash dashboards are carefully designed to surface important metrics by default. Here are the graphs that are included in the dashboard:
- OpCounters: The number of operations that MongoDB performs per second, broken up by the type of the operation, is shown in this graph. These counts include all received operations, including ones that were not successful also. The count is per operation, in that even if the operation involves multiple documents, it is counted only once. Secondaries also contribute to the operations count. The MongoDB docs have more info.
- Asserts: This graph plots the number of asserts that are raised each second. While some asserts are benign (for example, a wrong password while invoking a mongo shell), most are not. Persistently high values and deviations from trends should be investigated. The asserts in this graph are broken up by the type of the assert. See MongoDB docs for more info.
- Memory Usage: Shows the resident, virtual and mapped memory sizes used by the MongoDB server process. The value of resident typically gets close to the physical memory size, and mapped to the total database size.
- Open Connections: This graph shows the number of currently open connections to the database. Be sure to set an alert for a reasonable upper limit, considering any connections that might happen for transient jobs, like nightly batch jobs.
- Lock Queue: MongoDB queues readers and writers that need to place temporary locks on the database (see here for more info). This graph plots the number of readers and writers in the queue. Typically, these numbers should be small and should never build up.
- Requests Per Second: The number of requests being served by the database each second.
- Data Size: This graph plots the total size of all databases on the server. OpsDash queries each database on the MongoDB server and aggregates individual sizes to get this value. This number is the size of the actual data (plus any padding), and does not include storage, journal or namespace size.
- Counts: The number of databases, the number of collections (across all databases) and the number of objects (across all collections) are shown in this graph. Counts naturally tend to go up, and are useful in capacity planning.
- Average Object Size: This is a good number to keep an eye on, mainly because of it’s impact on performance. Most processing times will depend on the size of the data it has to pull and push from the database, and the average object size (which is the data size divided by the number of objects; across all databases) is an indicator of this.
Replication Monitoring
Production MongoDBs are usually set up with multiple secondaries, which
remain in constant sync with the primary. Secondaries may fail to do this
for various reasons, like bad network, a crashed mongod process or a
primary that is simply too fast for the secondary. These situations result in
a “replication lag”.
During normal operations, the replication lag should be within a reasonable upper bound of time, depending on the size and scale of your MongoDB usage.
To monitor replication lag with OpsDash, simply see the “Replication Lag” graph of the primary MongoDB’s dashboard:
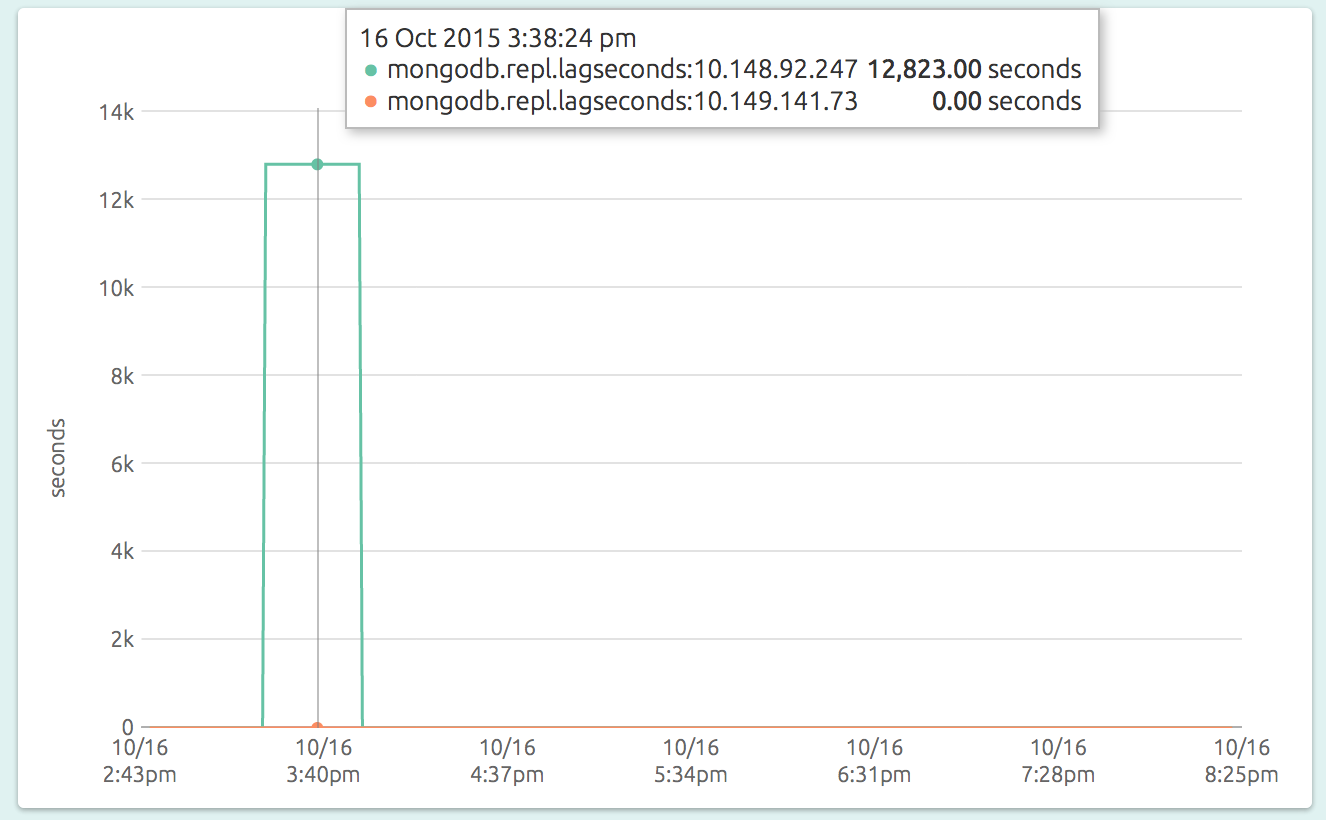
The graph has a line for each secondary, plotting the current replication lag between that and the primary, in seconds. Here you see that one of the secondaries (at 10.148.92.247) lagged for a while before the situation was corrected, while the other secondary (at 10.149.141.73) remained in sync all along.
You’ll want to set warning and critical upper limits for these metrics so that you can catch a runaway secondary before it is too late.