What is CPU Usage Anyway?
CPU Usage is a picture of how the processors in your machine (real or virtual) are being utilized.
In this context, a single CPU refers to a single (possibly virtualized) hardware hyper-thread. Remember that there might be multiple physical processors in a machine, each with multiple cores, and each core with multiple hyperthreads. In Linux, the hyperthread is the most granular, independently schedulable execution unit. This is the “single CPU”.
Now imagine someone taking a look at all the CPUs every 1/100th of a second, and noting down what type of task each one is executing. There aren’t that many types of tasks (see next section). For each type of task a counter is maintained, so that while sampling if you see that a CPU is executing a particular task type, that counter is incremented. If a CPU executes user code for 1 second, it’s user-code-counter will get incremented by 100.
These counters are maintained by the kernel itself, and can be read from the
file /proc/stat (more below).
Note: Technically the magic number 1/100 may be different for your system – you
should really be using the value of sysconf(_SC_CLK_TCK) instead.
Components of CPU Usage
So what “types of tasks” are there? The obvious ones are “user” and “system”:
- System: The CPU is running kernel code. This includes device drivers and kernel modules.
- User: The CPU is running code in user-mode. This includes your application code. Note that if an application tries to read from disk or write to network, it actually goes to sleep while the kernel performs that work, and wakes up the application again.
The categorization could stop here, but there a few more, to provide better insight into what is going on:
- Nice: The user code can be executed in “normal” priority, or various degrees of “below normal” priority. You can, for example, run some kind of report generation process at a lower priority and interactive processes at normal priority. Nice is when the CPU is executing a user task having below-normal priority.
- I/O Wait: Sometimes the CPU has only one thing to do – wait for the results of a disk/network read/write. This isn’t as uncommon as you’d think. A file server for example would nearly spend all it’s life waiting for disk reads and network writes to complete. I/O Wait is when the CPU is waiting for an I/O operation to complete, and the CPU can’t be used for anything else.
- Steal: When running in a virtualized environment, the hypervisor may “steal” cycles that are meant for your CPUs and give them to another, for various reasons. This time is accounted for as steal.
- Idle: And when there is really nothing the kernel can do, it just as to waste away this slice of time. Technically, when the runnable queue is empty and there are no I/O operations going on, the CPU usage is marked as idle.
And there are a couple of other types too, which you probably won’t see much of:
- IRQ and SoftIRQ: The kernel is servicing interrupt requests (IRQs).
- Guest and Guest Nice: The process (a hypervisor) is running a virtual CPU. These numbers are already included in User and Nice.
Getting the Raw Values
The CPU usage values are maintained by the kernel, in memory. These values are
exposed via the proc filesystem, as the /proc/stat file:
# cat /proc/stat
cpu  1421 544 852 94554 539 0 7 24 0 0
cpu0 1421 544 852 94554 539 0 7 24 0 0
intr 38396 17 9 0 0 0 0 3 0 1 0 0 48 15 0 0 1048 0 0 0 0 0 0 0 0 0 6716 0 1266 1 0 0 0 0 0 0 0 0 0 0 0 0 0 0 0 0 0 0 0 0 0 0 0 0 0 0 0 0 0 0 0 0 0 0 0 0 0 0 0 0 0 0 0 0 0 0 0 0 0 0 0 0 0 0 0 0 0 0 0 0 0 0 0 0 0 0 0 0 0 0 0 0 0 0 0 0 0 0 0 0 0 0 0 0 0 0 0 0 0 0 0 0 0 0 0 0 0 0 0 0 0 0 0 0 0 0 0 0 0 0 0 0 0 0 0 0 0 0 0 0 0 0 0 0 0 0 0 0 0 0 0 0 0 0 0 0 0 0 0 0 0 0 0 0 0 0 0 0 0 0 0 0 0 0 0 0 0 0 0 0 0 0 0 0 0 0 0 0 0 0 0 0 0 0 0 0 0 0 0 0 0 0 0 0 0 0 0 0 0 0 0 0 0 0 0 0 0 0 0 0 0 0 0 0 0 0 0 0 0 0 0 0 0 0 0 0 0 0 0 0 0 0 0 0 0 0 0
ctxt 104709
btime 1491368705
processes 3309
procs_running 1
procs_blocked 0
softirq 46630 0 20544 0 1295 505 0 24 0 0 24262
The line with the first field as cpu, shows the actual values of each counter,
in this order: user, nice, system, idle, iowait, irq, softirq, steal, guest and
guest_nice. These are totalled up numbers for all the CPUs. The remaining lines
show the numbers for invidual CPUs (there is only 1 CPU in this example,
referred to in the output as cpu0).
Viewing CPU Usage
The /proc/stat file is bit hard to parse for humans, though. How can we
visualize this data? One tool is top:
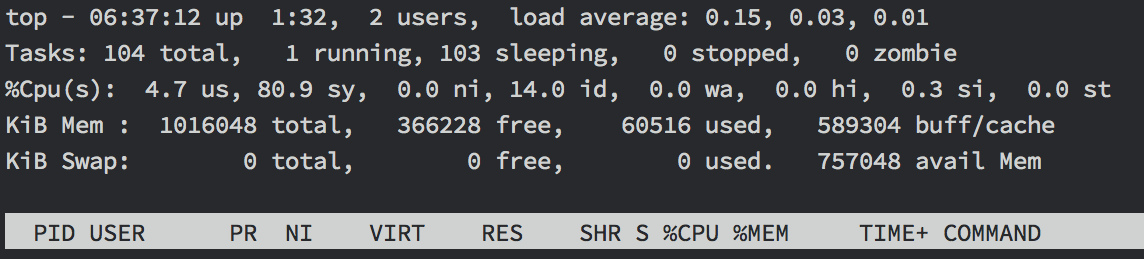
Here top shows the CPU usage as user = 4.7%, system = 80.9% and idle = 14%.
Monitoring CPU Usage
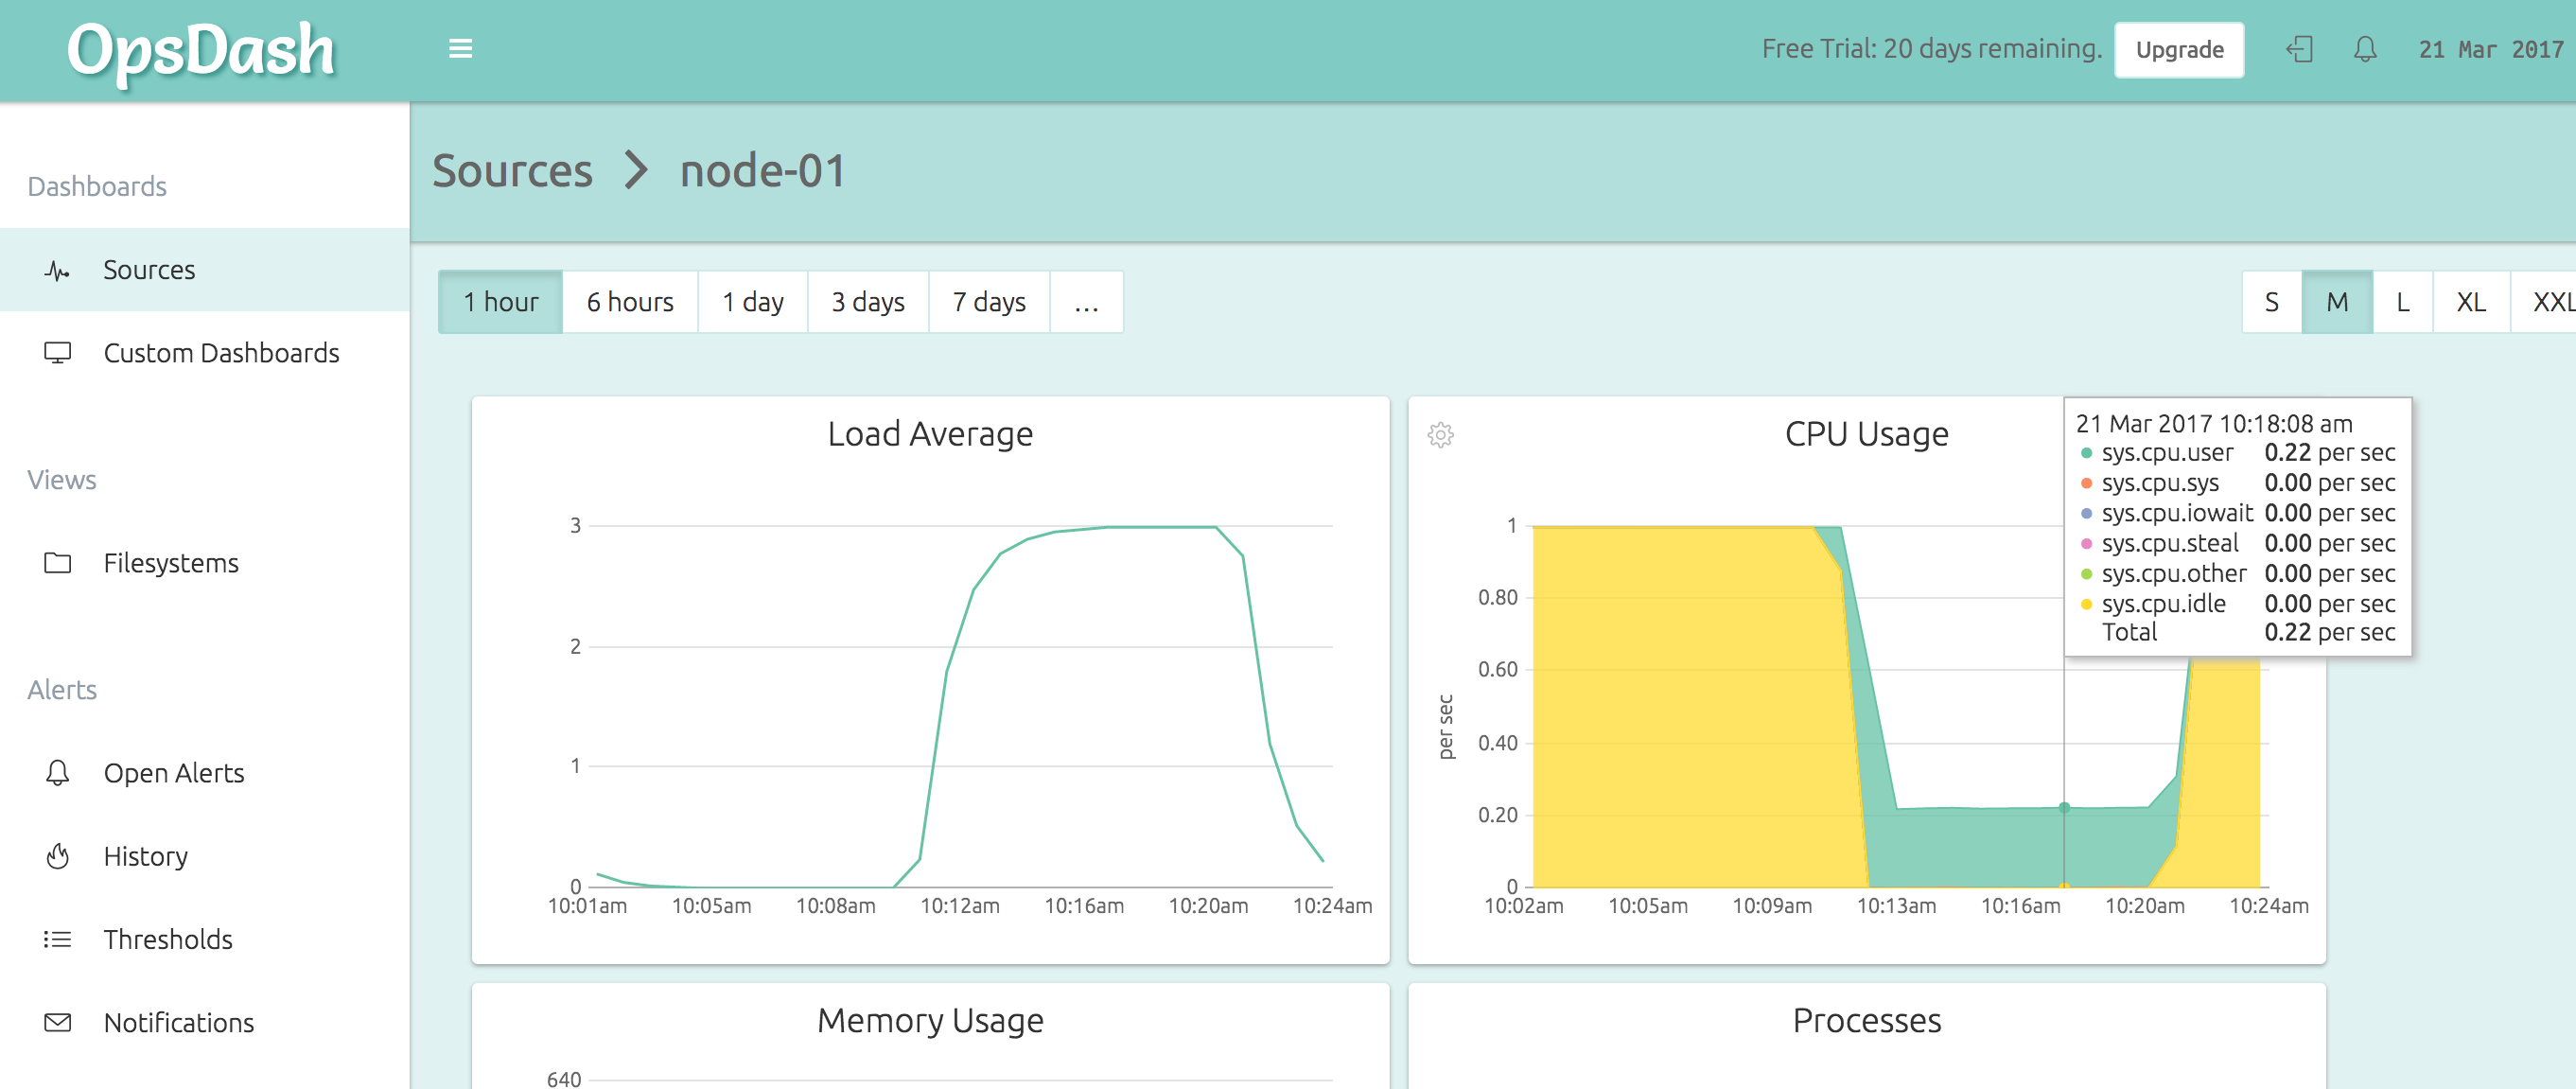
Monitoring your CPU usage using tools like OpsDash affords better
understanding and analysis. For example, here is the CPU Usage graph of a node
in OpsDash, doing a kernel-intensive operation (allocating and freeing pages of
memory, using the stress utility):
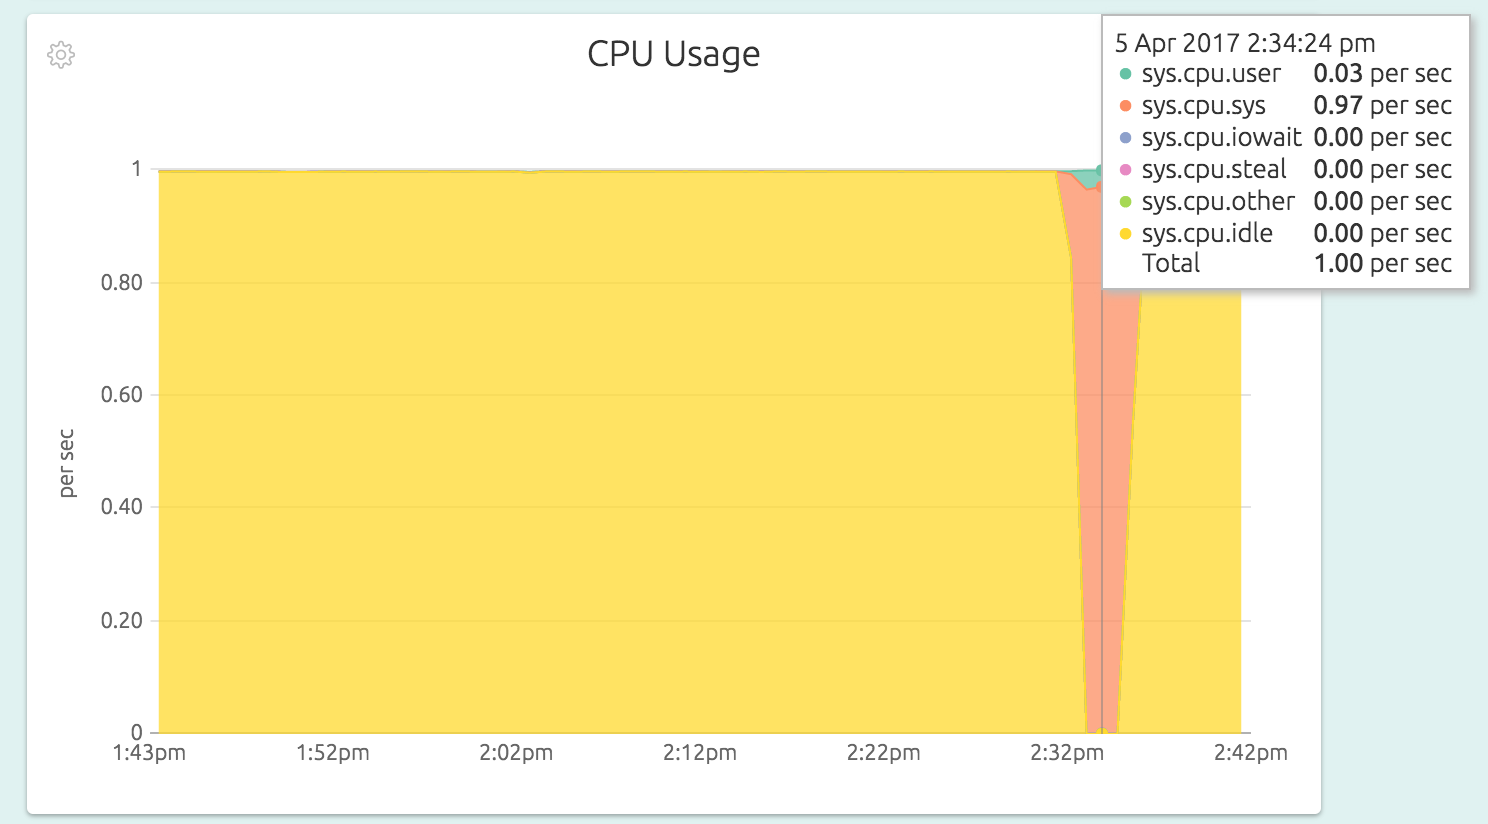
This can uncover interesting scenarios, like for example the throttling of CPU in an f1-micro instance on the Google Cloud Platform:
Making use of CPU Usage Information
CPU Usage can be a very “expressive” metric. That is to say, a quick check of the CPU usage graph of a server can reveal a lot about the workload. For example:
- A report generation process runs every day for half a hour. During the period you see a lot of I/O wait – maybe your SQL queries are pulling in too much data? Queries not utilizing indexes?
- Or maybe the report run takes too much user CPU these days – is some algorithm not scaling well with data?
- App server is taking too much system CPU – too many memory allocations/frees/GCs? Too many small disk/network reads/writes?
- User CPU is 100% when page response times are high – you need to optimize your code!
New Here?
OpsDash is a server monitoring, service monitoring, and database monitoring solution for monitoring MySQL, PostgreSQL, MongoDB, memcache, Redis, Apache, Nginx, Elasticsearch and more. It provides intelligent, customizable dashboards and spam-free alerting via email, HipChat, Slack, PagerDuty and Webhooks. Send in your custom metrics with StatsD and Graphite interfaces built into each agent.