Here is a quick overview of 5 command-line tools that come in incredibly handy when troubleshooting or monitoring real-time disk activity in Linux. These tools are available in all major Linux distros.
iostat
iostat can be used to report the disk read/write rates and counts for an
interval continuously. It collects disk statistics, waits for the given amount
of time, collects them again and displays the difference. Here is the output
of the command iostat -y 5:
Each report, every 5 seconds, include the CPU stats and the disk stats. The CPU
stats is a break up of where CPU time was spent during the interval. The disk
stats includes the number of I/O requests per second (tps), the rate of read
and write (kB_read/s and kB_write/s) and the amount of data read and written
(kB_read and kB_wrtn).
The -y argument instructs iostat to discard the first report which are the
stats since boot and are rarely useful. The “5” in the command line specifies
the interval in seconds. The CPU stats can be omitted by including the -d
flag, although practically it is useful to have it there.
iotop
iotop is a top-like utility for displaying real-time disk activity. It can
list the processes that are performing I/O, alongwith the disk bandwidth they
are using. Here is how iotop -o looks like:
The -o flag restricts the display to processes that are doing I/O, omitting
it shows all the processes. You can also see the total disk bandwidth usage
on the top two lines.
In case you are wondering, the “total” values show the amount of data read from or written to the disk block device driver, and the “actual” values show the numbers for the actual hardware disk I/O. File system caching is one of the reasons for the difference in the values.
dstat
dstat is a little more user-friendly version of iostat, and can show much
more information than just disk bandwidth. Here is dstat in action, showing
cpu and disk stats:
As you can see, it has nicely colored output. The command-line flags include
-c for CPU stats, -d for disk stats, --disk-util for disk utilization
and --disk-tps for disk transactions (I/O requests) per second. You can read
more about dstat here.
atop
atop is particularly good for quickly grasping changes happening to the
system. It does an excellent job of summarizing changes in each
interval. Unlike the others, it can list all the processes that caused any
system-level changes (like doing disk I/O) during the interval – this feature
is present only in atop.
Here we’re running atop with an interval of 1 second. The top section should
be read from left to right: PRC shows process information, CPU the split of
CPU usage, CPL the load averages, MEM the memory usage, SWP the swap file
usage and DSK and NET the disk and network information respectively. The
bottom section shows processes that did interesting things during the interval.
You can read more about atop here.
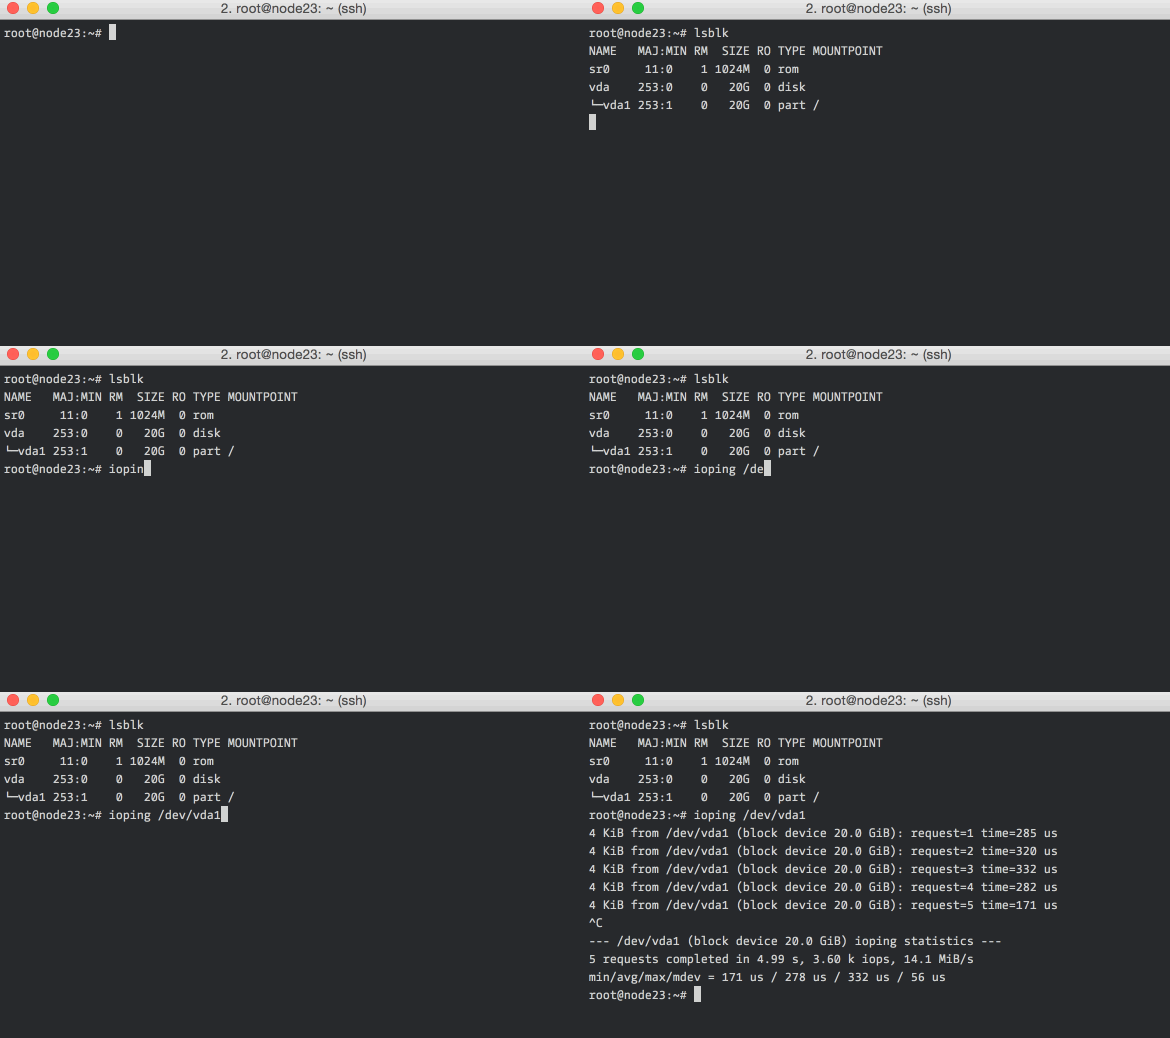
ioping
ioping is a quick and dirty storage volume latency checker. It is useful for
checking if the elevated disk times that you’re seeing are because of a
degradation of the underlying virtual disk / network / hardware.
Low numbers (<1ms) and low variance in the numbers are indicators of a healthy storage volume.
Closing Notes
All the tools listed above have more features and options, here are good places to start digging further: iostat, iotop, dstat, atop and ioping.
If you’re interested in measuring disk performance, you should definitely also look at fio and sysbench. Both are fairly complicated, but are standard tools for the job.
New Here?
OpsDash is a server monitoring, service monitoring, database monitoring and application metrics monitoring solution for monitoring MySQL, PostgreSQL, MongoDB, Memcache, Redis, Apache, Nginx, Elasticsearch and more. It provides intelligent, customizable dashboards and spam-free alerting via email, HipChat, Slack, OpsGenie, PagerDuty and Webhooks. Send in your custom metrics with StatsD and Graphite interfaces built into the OpsDash Smart Agent.


