Docker and containers are becoming ever more popular and settling into the standard toolkit of developers and ops folks. Read on to learn more about the Docker API and monitoring Docker.
The Docker API
Docker runs as a daemon named “dockerd”, which serves as the top-level interface to Docker’s core functionality. The “docker” command line tool for example, talks to dockerd to get your task done.
The API that dockerd exposes, variously called the Docker API or the Docker Remote API, is documented here. It’s json-based and REST-ish, and has SDKs for Go and Python. There are also a bunch of unoffical SDKs for other languages.
By default though, the API is hosted not over an HTTP-over-TCP interface, but
over a unix socket at /var/run/docker.sock. The HTTP requests are written
to the unix socket, and replies are read from there.
Enabling The Remote API
The Docker daemon does support serving up this interface over a regular HTTP (over TCP) interface though. Here’s how to do it, for a systemd-based distro (recent versions of CentOS/RHEL/Ubuntu/Debian qualify):
$ sudo mkdir /etc/systemd/system/docker.service.d
$ sudo tee /etc/systemd/system/docker.service.d/override.conf <<EOD
[Service]
ExecStart=
ExecStart=/usr/bin/dockerd -H tcp://0.0.0.0:2375 -H unix:///var/run/docker.sock
EOD
$ sudo systemctl daemon-reload
$ sudo systemctl restart docker
The commands create an override configuration for the docker service, updating the command-line used to invoke the daemon. It now includes the additional interface endpoint “tcp://0.0.0.0:2375”, apart from the default one of “unix:///var/run/docker.sock”. The last two commands tell systemd to reload the file and restar the docker daemon.
And yes, the extra “ExecStart=” line is not a typo.
The port 2375 is the de-facto standard for the Docker API. As it stands, the endpoint is unauthenticated and unencrypted. It must be exposed only in a controlled manner to only the needed tools. You can add encryption using https and authentication using client-side certificates and authorization plugins.
The APIs
The API allows you do to all that you can do via the docker command line interface. Here is an example that lists the IDs of all running containers. The full API documentation is here.
You should be able to use a newer API to talk to a Docker exposing an older version of the API, within reasonable limits.
The APIs also let you work with Docker swarm.
Monitoring with OpsDash
Both the self-hosted and SaaS versions of OpsDash support monitoring your Docker daemons. They extract metrics from Docker using the API described above. OpsDash saves you the hassle of figuring out metrics and setting up dashboards, so that you’re off to a quick start! Here’s is how a default Docker dashboard from OpsDash looks like:
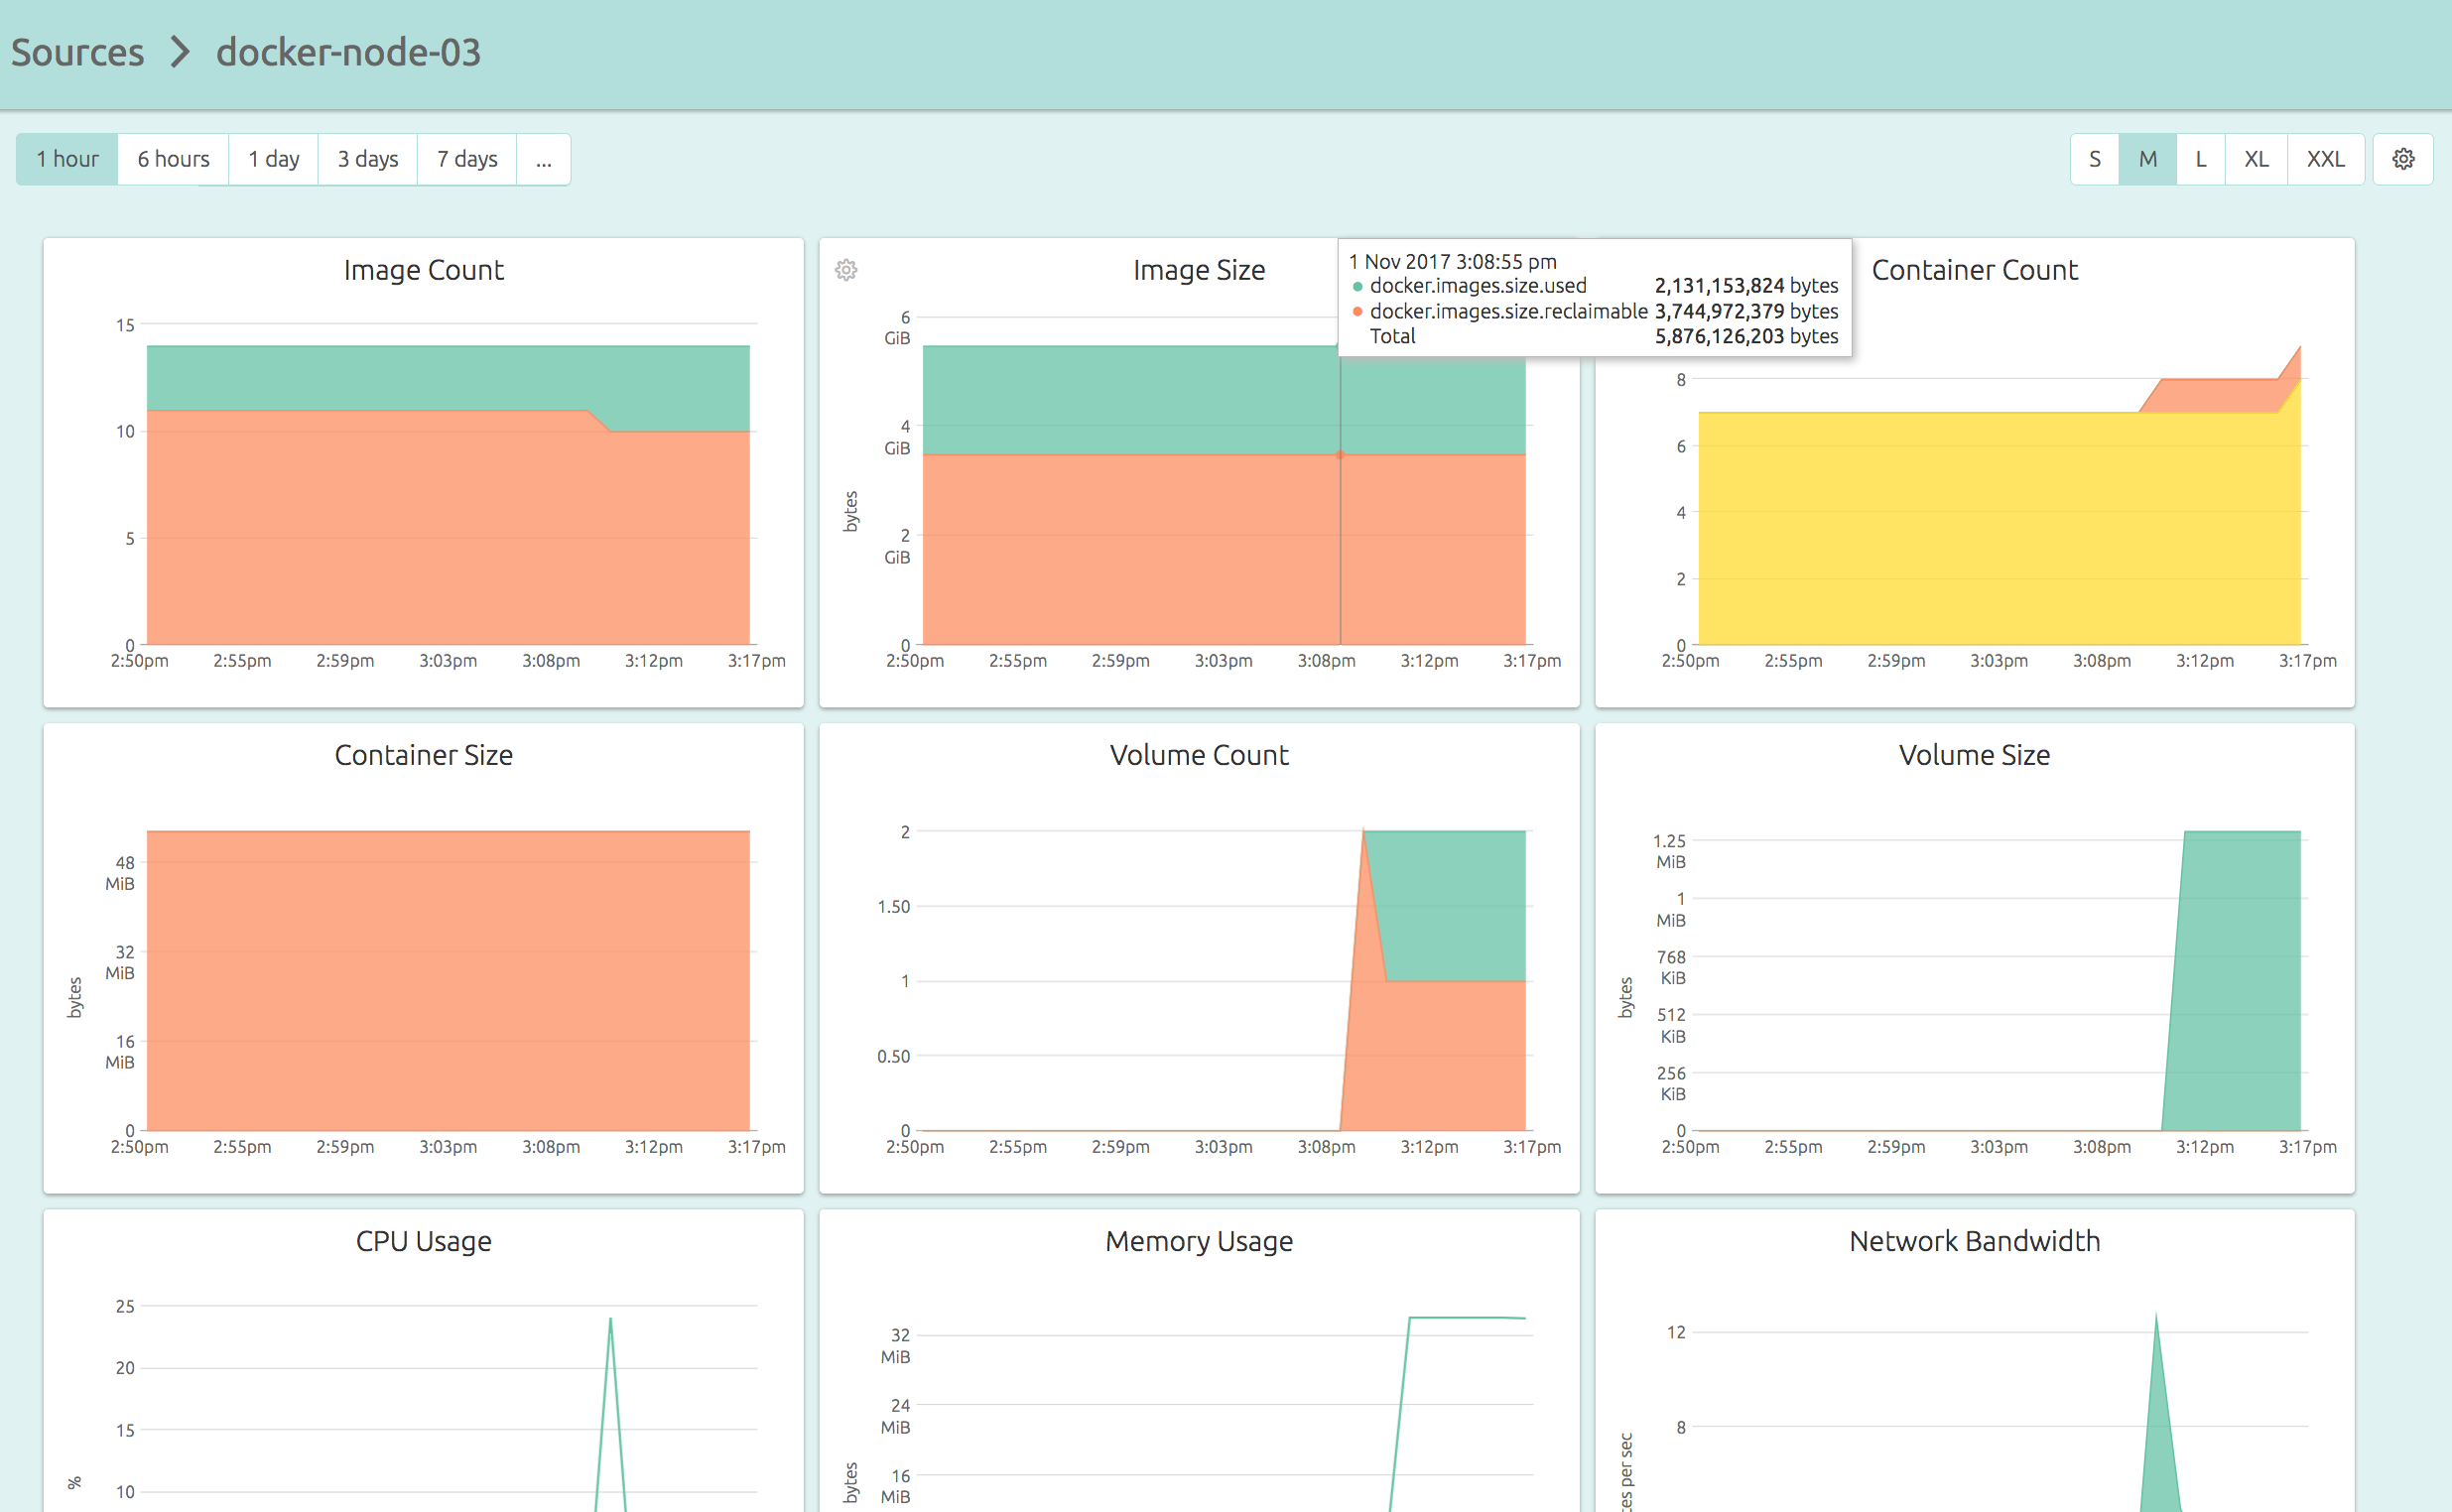
Here are the graphs that constitute the default dashboard:
- Image Count: The count of active and inactive images stored locally by Docker.
- Image Size: The total disk usage of active and reclaimable images stored locally by Docker.
- Container Count: The count of containers, segragated by state: created, running, paused, restarting, removing, exited and dead.
- Container Size: The total size of disk used by containers, with used and reclaimable parts tracked separately.
- Volume Count: The count of active and inactive volumes maintained by this Docker daemon.
- Volume Size: The total size of disk used by volumes, with used and reclaimable parts tracked separately.
- CPU Usage: The percentage of host CPU used by all currently running containers.
- Memory Usage: The amount of host memory used by all currently running containers.
- Network Bandwidth: The transmit and receive bandwidth of host network used by all currently running containers.
- Disk Throughput: The disk read and write throughput (bytes/second) used by all currently running containers.
- Process Count: The total number of processes running across all containers currently.
You can of course, customize the dashboard, as well as set alerts for any metric. OpsDash can alert you via emails, Slack, HipChat, PagerDuty, OpsGenie, VictorOps or Webhooks when things begin to look wonky.
New Here?
OpsDash is a server monitoring, service monitoring, and database monitoring solution for monitoring Docker, MySQL, PostgreSQL, MongoDB, memcache, Redis, Apache, Nginx, Elasticsearch and more. It provides intelligent, customizable dashboards and rule-based alerting via email, HipChat, Slack, PagerDuty, OpsGenie, VictorOps and Webhooks. Send in your custom metrics with StatsD and Graphite interfaces built into each agent.