Here’s a guide on how to setup an Elasticsearch cluster. We’ll also see how the cluster can be monitored with ease using OpsDash.
We’ll be setting up a 3 node cluster with all nodes running Elasticsearch 2.3 in master+data mode, on an Ubuntu 16.04. We’ll assume that these nodes can talk to each other over a private network, and that the hostnames and private IPs of the nodes are:
es-node1   10.99.0.10
es-node2   10.99.0.11
es-node3   10.99.0.12
Setting up each node
First let’s install and configure Elasticsearch on each node. Follow the steps below for each of the 3 nodes.
1. Adding the Elasticsearch repo
We’ll use the Elasticsearch APT repo to fetch and install the packages from. To do this, first add their signing key:
wget -O /tmp/eskey https://packages.elastic.co/GPG-KEY-elasticsearch
sudo apt-key add /tmp/eskey
rm /tmp/eskey
and then add the repo URL to your sources list:
sudo tee /etc/apt/sources.list.d/elasticsearch-2.x.list <<EOREP
deb https://packages.elastic.co/elasticsearch/2.x/debian stable main
EOREP
Let’s also do an update now:
sudo apt-get -yq update2. Install the JDK
Before we install Elasticsearch, we’ll need to install Java. You have a choice of Oracle JDK that needs to be setup manually, or OpenJDK that comes bundled with Ubuntu. To use the Oracle JDK, follow the steps in this blog post. For OpenJDK, run the command:
sudo apt-get -yq install openjdk-8-jdkRegardless of which one you use, the rest of the steps remain the same.
3. Install Elasticsearch
Now we’re ready to install Elasticsearch. Since we configured the repo, this is only a matter of:
sudo apt-get -yq install elasticsearch4. Configure Elasticsearch
We’ll need to update 3 files on each node to get the configuration right.
First up is the main configuration file /etc/elasticsearch/elasticsearch.yml.
Uncomment and edit the following lines:
# The name of the cluster. Must be the same for all nodes.
cluster.name: cluster1

# The name for the node. Using the node's hostname is a good choice.
node.name: es-node1

# Specify the private IP of the node.
network.host: 10.99.0.10

# Allow Elasticsearch to lock it's address space.
bootstrap.mlockall: true

# List the IPs of all the nodes here. Most cloud providers don't support
# multicast, so we have to explicitly identify nodes like this.
discovery.zen.ping.unicast.hosts: ["10.99.0.10", "10.99.0.11", "10.99.0.12"]

# In our case, we need a majority of 2 at all times to avoid "split brain".
discovery.zen.minimum_master_nodes: 2
Next we’ll configure the Java heap size in /etc/default/elasticsearch. In
this file, uncomment and set the value:
ES_HEAP_SIZE=4gThe value should be 50% of available RAM, but not more than 31g (the JVM garbage collector slows down after this limit).
And finally, we need to tell systemd to allow Elasticsearch to do an mlock.
Do this by uncommenting the following line in
/usr/lib/systemd/system/elasticsearch.service.
LimitMEMLOCK=infinityBefore we continue, ensure that the above steps are done in each node – this is important.
5. Start the service
On each node, you can now enable and start the service:
sudo systemctl daemon-reload
sudo systemctl enable elasticsearch
sudo systemctl start elasticsearch
You can see the contents of the file /var/log/elasticsearch/cluster1.log to
see if the daemon started up properly. It should look something like this, after
all the nodes have started up:
Setup Monitoring
OpsDash is a self-hosted server and service monitoring solution, which can monitor Elasticsearch clusters, nodes and indexes. It’s free to use for up to 5 servers and 5 services. Let’s see how to set it up for our cluster:
1. Install OpsDash server:
Download and install the OpsDash server on any machine that can connect to the Elasticsearch nodes:
wget https://packages.rapidloop.com/downloads/opsdash-server_1.8_amd64.deb
sudo dpkg -i opsdash-server_1.8_amd64.deb
sudo systemctl start opsdash-serverd
OpsDash should be up and running after these commands. You can browse to
http://the.server:8080/ to see the OpsDash UI, where the.server is the
IP of the server you installed OpsDash on. Remember to open up the port in your
firewall if you need to.
2. Tell OpsDash about the Elasticsearch cluster:
From the OpsDash UI, let’s add an entry for the Elasticsearch cluster. From the System Settings -> Services page, add an “Elasticsearch Cluster” service, supplying the IP of any node:
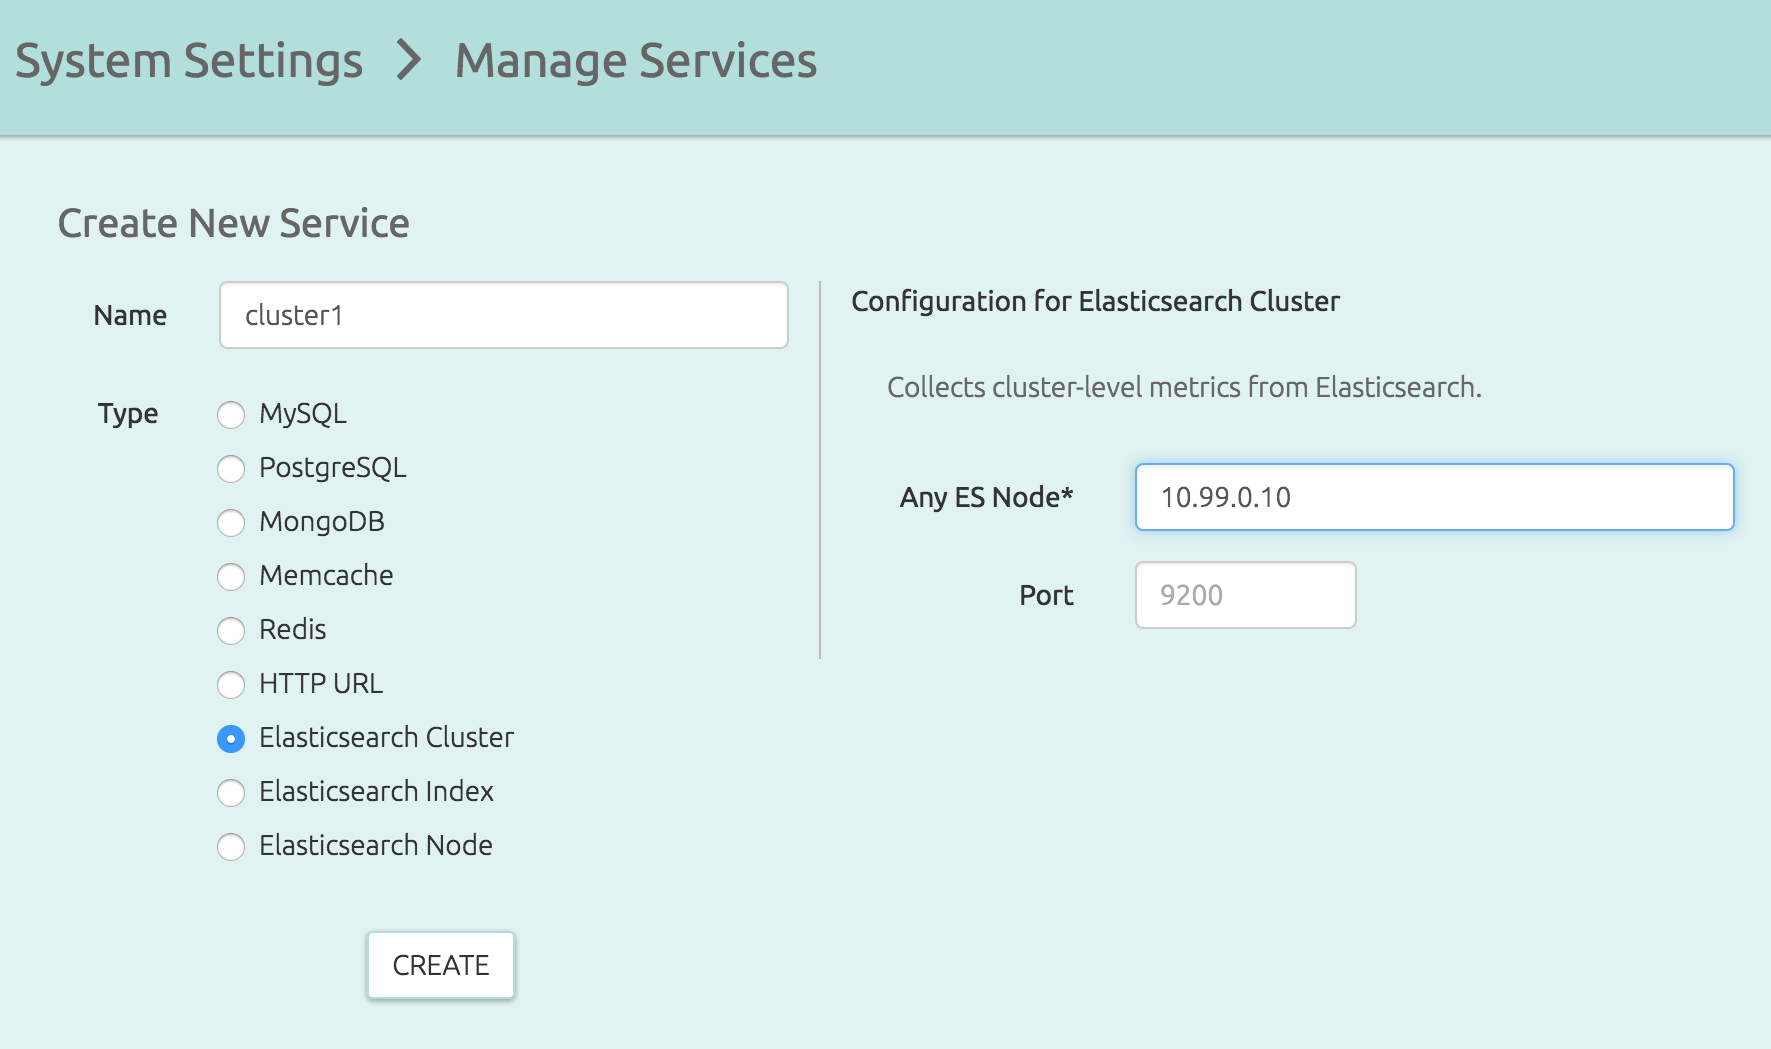
The “Elasticsearch Cluster” gives an overview of the whole cluster. You can also monitor individual nodes in the cluster, or individual indexes, by adding “Elasticsearch Node” or “Elasticsearch Index” services from this same page.
3. See the dashboards:
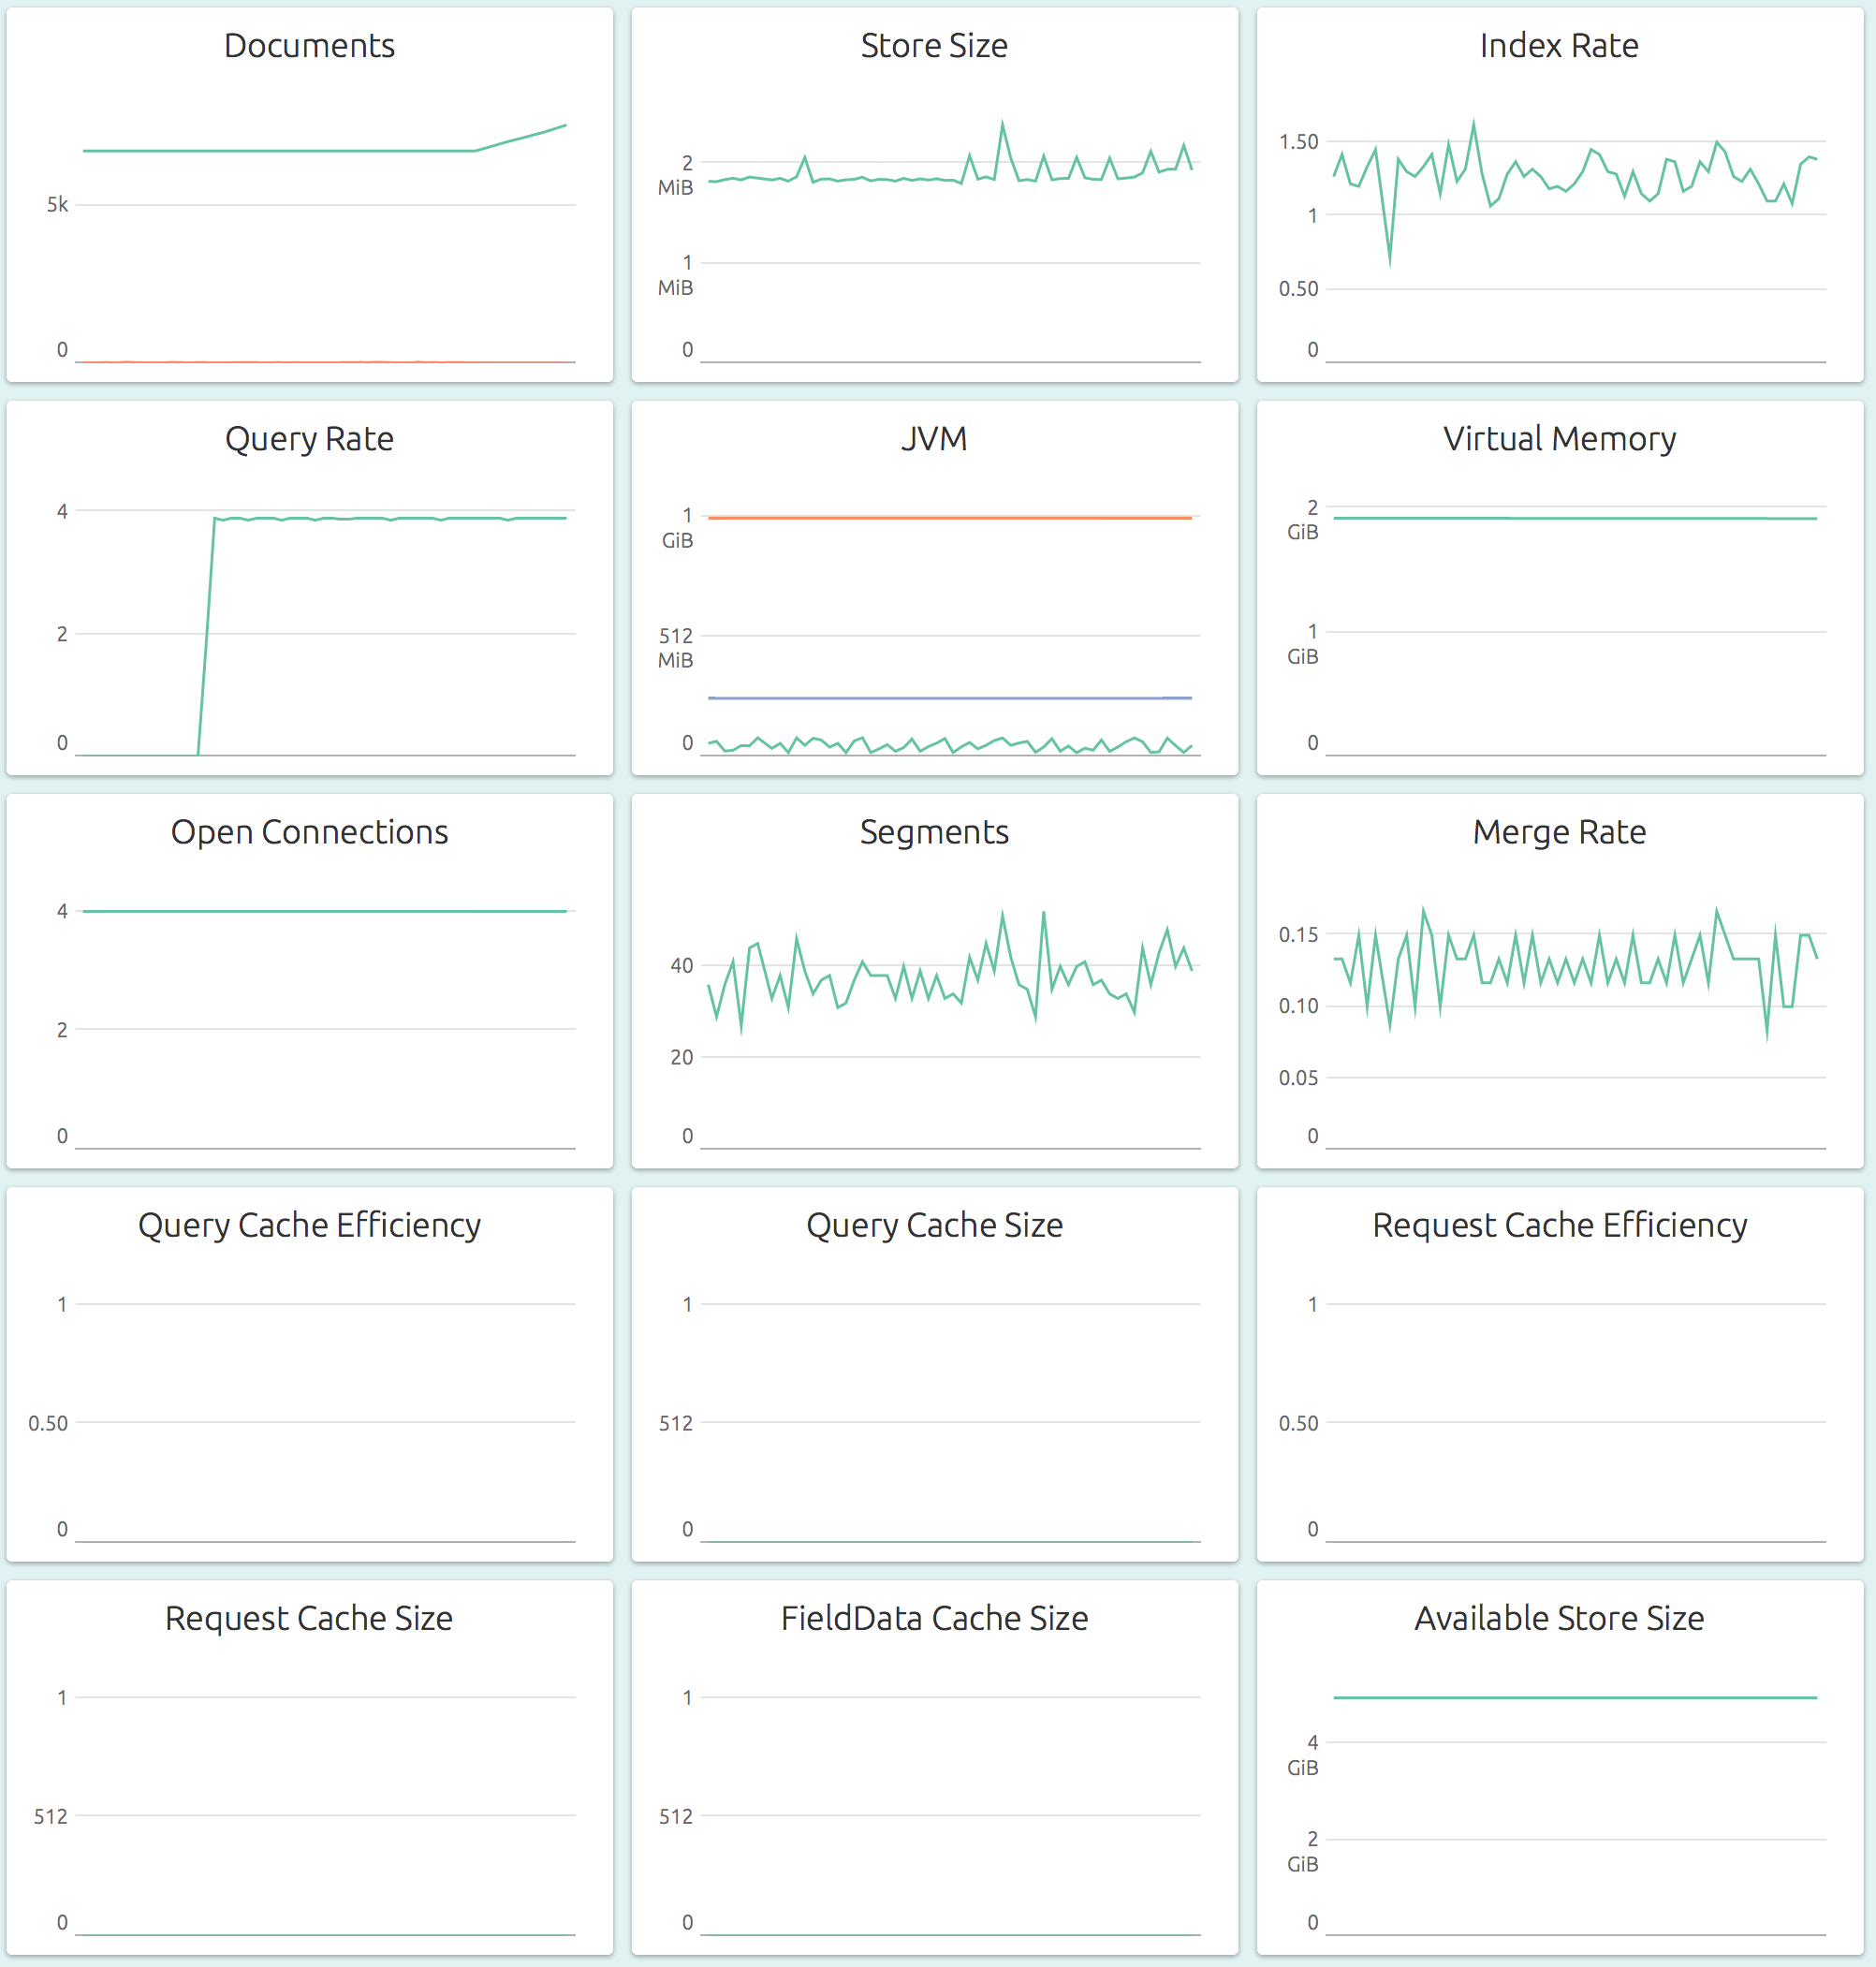
The dashboard for the cluster (Sources -> “cluster1”) shows an aggregated overview of storage, JVM memory usage, segments and node and shard status. You can click on any graph and set alerting thresholds. OpsDash can notify you via email, Slack, HipChat, PagerDuty or Pushbullet when alerts happen.
The node-level graphs show numbers for a specified, single node of the cluster. At this level, both resource level (storage, memory, connections) and application level (index, merge, cache) graphs are available, which is what makes it the most informative dashboard to keep an eye on.
The index-level dashboard shows metrics at the logical index level, rather than at the physcial cluster or node level. This makes it easy to observe the changes happening to a particular index when more than one is present on the same node.
Further Reading
The Elasticsearch Reference has a chapter on setup. Different types of nodes (like master and data) are explained here. If you need to open up ports in your firewall for the nodes to talk to each other, this should help. And finally, before you stop an individual node in a cluster, you’ll want to read this.
You can find out more about OpsDash here. OpsDash is a self-hosted server and service monitoring solution with integrated support for Elasticsearch monitoring.
Have more tips? Feel free to leave a comment below!