Here is a quick guide on setting up an Elasticsearch 5.2 server on an Ubuntu 16.04 LTS, with practical advice on securing the installation.
Installation
Let’s spin up a node in your favorite cloud provider, with an Ubuntu 16.04 base image. First off, we need to set up the Java SDK. While Elasticsearch can work with OpenJDK, it is recommended to use Oracle’s JDK. The Oracle JDK page provides only RPMs and tarballs, they do not offer .deb packages. You can, however, follow these steps to install the Oracle JDK properly on a Debian-based system like Ubuntu.
Next, let’s install Elasticsearch itself. We’ll install from Elastic’s APT repository:
# add the Elastic APT repo
echo "deb https://artifacts.elastic.co/packages/5.x/apt stable main" | sudo tee -a /etc/apt/sources.list.d/elastic-5.x.list

# trust the signing key
sudo apt-key adv --keyserver hkp://pgp.mit.edu:80 --recv D88E42B4

# update repo information
sudo apt-get -yq install apt-transport-https
sudo apt-get -yq update

# install
sudo apt-get -yq install elasticsearch
Authentication and Authorization
Elasticsearch does not provide user management by itself, out of the box. For this, you need to install both Kibana and X-Pack. Note that these products are licensed separately and you’ll probably need to purchase licenses for continued use.
Installing Kibana
Since we already configured the APT repository, installing Kibana can be done
with an apt-get:
sudo apt-get -yq install kibanaInstalling X-Pack
X-Pack is packaged as Elasticsearch and Kibana plugins. You’ve to use the bundled plugin tool to install it:
# install x-pack for elasticsearch  (reply 'y' to permissions question)
cd /usr/share/elasticsearch
sudo bin/elasticsearch-plugin install x-pack

# install x-pack for kibana
cd /usr/share/kibana
sudo bin/kibana-plugin install x-pack
Private Network
Ideally, the Elasticsearch node, as well as the other nodes that need to talk to the Elasticsearch nodes should be placed on a secure, internal network. All communication with Elasticsearch should take place over this network, and never over public internet. Additionally, even this communication over the private network should be encrypted.
For example, Google Cloud provides a private network for all the VMs in a project, and each VM can get a public IP as well as a private IP. DigitalOcean provides a “shared private” network, which really is not a “private” network. Any port you expose over a “private” IP on DigitalOcean is accessible to all the droplets in that datacenter.
If your cloud provider does not provide a true private network, you should consider building an overlay VPN, for example using OpenVPN, Tinc VPN, or even Weave.
Configuring
Now that we have the components installed, let’s configure and bring up the
whole thing. First, let’s configure Elasticsearch by editing
/etc/elasticsearch/elasticsearch.yml. You’ll want to edit/set at least these
entries:
# name your cluster, all nodes in the cluster must have same cluster name
cluster.name: name-of-cluster

# use the private IP of the node here
network.host: the.private.ip

# allow Elasticsearch to mlock()
bootstrap.memory_lock: true
Next, we need to allow mlock in the systemd service configuration file also.
Edit the file /usr/lib/systemd/system/elasticsearch.service
and uncomment the following line:
LimitMEMLOCK=infinityLet’s also tell systemd that we modified the file:
sudo systemctl daemon-reloadWe also need to edit /etc/default/elasticsearch to set some sensible defaults:
# set the Java heap size to 50% of available physical memory
ES_JAVA_OPTS="-Xms2g -Xmx2g"

# uncomment this line to allow mlock()
MAX_LOCKED_MEMORY=unlimited
Finally, let’s also configure Kibana by editing /etc/kibana/kibana.yml:
server.host: "the.private.ip"

elasticsearch.url: "http://the.private.ip:9200"
We can now start Elasticsearch and Kibana.
sudo systemctl start elasticsearch

# wait until elasticsearch has started up, then..
sudo systemctl start kibana
Configure User Authentication
By enabling user authentication, you can permit access to your Elasticsearch only for users with credentials. You can define roles that can restrict any user’s access to a subset of data and operations as required. You can read more about users and roles here.
To configure user authentication, browse to the Kibana UI at http://the.private.ip:5601/. Since X-Pack
is installed, you’ll see a login screen. The default username is elastic and
password is changeme. Users and roles can be edited from Management tab in the
Kibana UI.
You can test by trying to connect to Elasticsearch without a username and password. This should fail. For example:
$ curl http://the.private.ip:9200/_cluster/stats
{"error":{"root_cause":[{"type":"security_exception","reason":"missing authentication token for REST request [/_cluster/stats]","header":{"WWW-Authenticate":"Basic realm=\"security\" charset=\"UTF-8\""}}]
[...snip...]
Setting up HTTPS
The communication between Elasticsearch clients and nodes, and between nodes should be encrypted. Without this, you’ll end up transmitting the passwords in plain text over the network.
This is achieved by configuring Elasticsearch to require https, rathen than
http for all communications. Start by running the certgen command:
$ cd /usr/share/elasticsearch
$ sudo bin/x-pack/certgen
This tool interactively prompts you for the DNS name and IP for each node in
your cluster. It will create a zip file (by default at
/etc/elasticsearch/x-pack/certificate-bundle.zip)
containing all the required certificates and keys. More information about
certgen can be found here.
Once you have the bundle zip file, unpack it to /etc/elasticsearch/certs like this:
cd /etc/elasticsearch
sudo mkdir certs
sudo unzip /etc/elasticsearch/x-pack/certificate-bundle.zip -d certs
sudo chown -R root:root certs
The directory should contain a bunch of subdirectories, one for each node in cluster, and one called “ca”. Each directory contains a SSL certificate and the corresponding (unencrypted) private key.
Add these lines at the end of your elasticsearch configuration file
/etc/elasticsearch/elasticsearch.yml to enable SSL:
xpack.ssl.key:                     /etc/elasticsearch/certs/node-1/node-1.key
xpack.ssl.certificate:             /etc/elasticsearch/certs/node-1/node-1.crt
xpack.ssl.certificate_authorities: [ "/etc/elasticsearch/certs/ca/ca.crt" ]
xpack.security.transport.ssl.enabled: true
xpack.security.http.ssl.enabled: true
Assuming “node-1” is the name of the node whose IP is “the.private.ip”.
You should also update /etc/kibana/kibana.yml to talk to Elasticsearch over
https:
elasticsearch.url: "https://node-1:9200"

elasticsearch.ssl.verify: false
After restarting Elasticsearch and Kibana, you should now have an Elasticsearch that accepts only SSL connections on port 9200.
Monitoring
OpsDash provides easy-to-setup Elasticsearch monitoring. You can start monitoring your Elasticsearch cluster, nodes and indexes in just a few seconds, thanks to OpsDash’s smart dashboards that display the most important health and performance metrics with zero configuration.
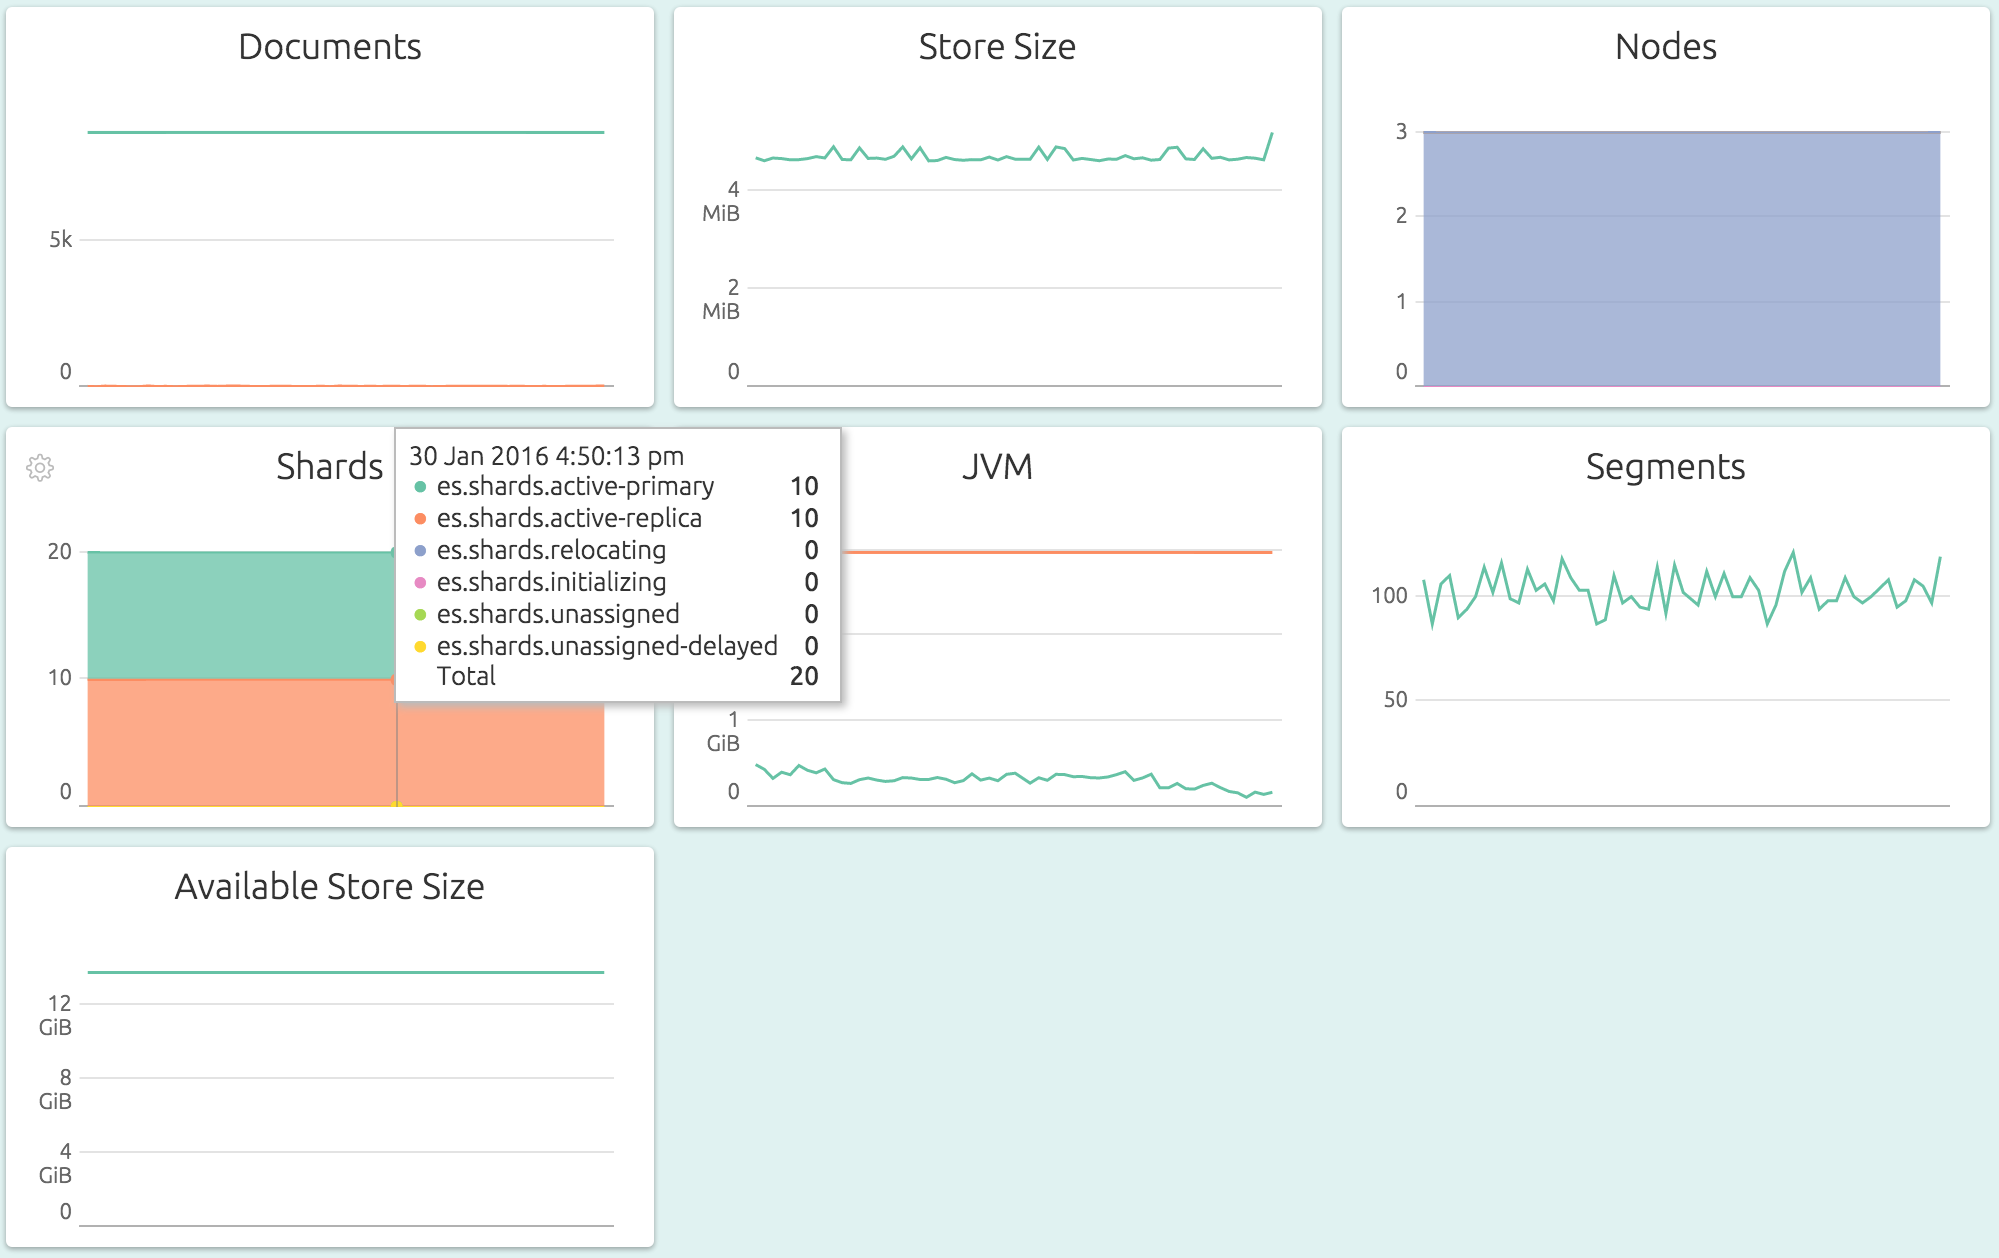
OpsDash offers Elasticsearch monitoring integration at Cluster, Node and Index levels.
Overall Cluster-level Metrics for quick, aggregated overview of storage, JVM memory usage, segments and node and shard status:
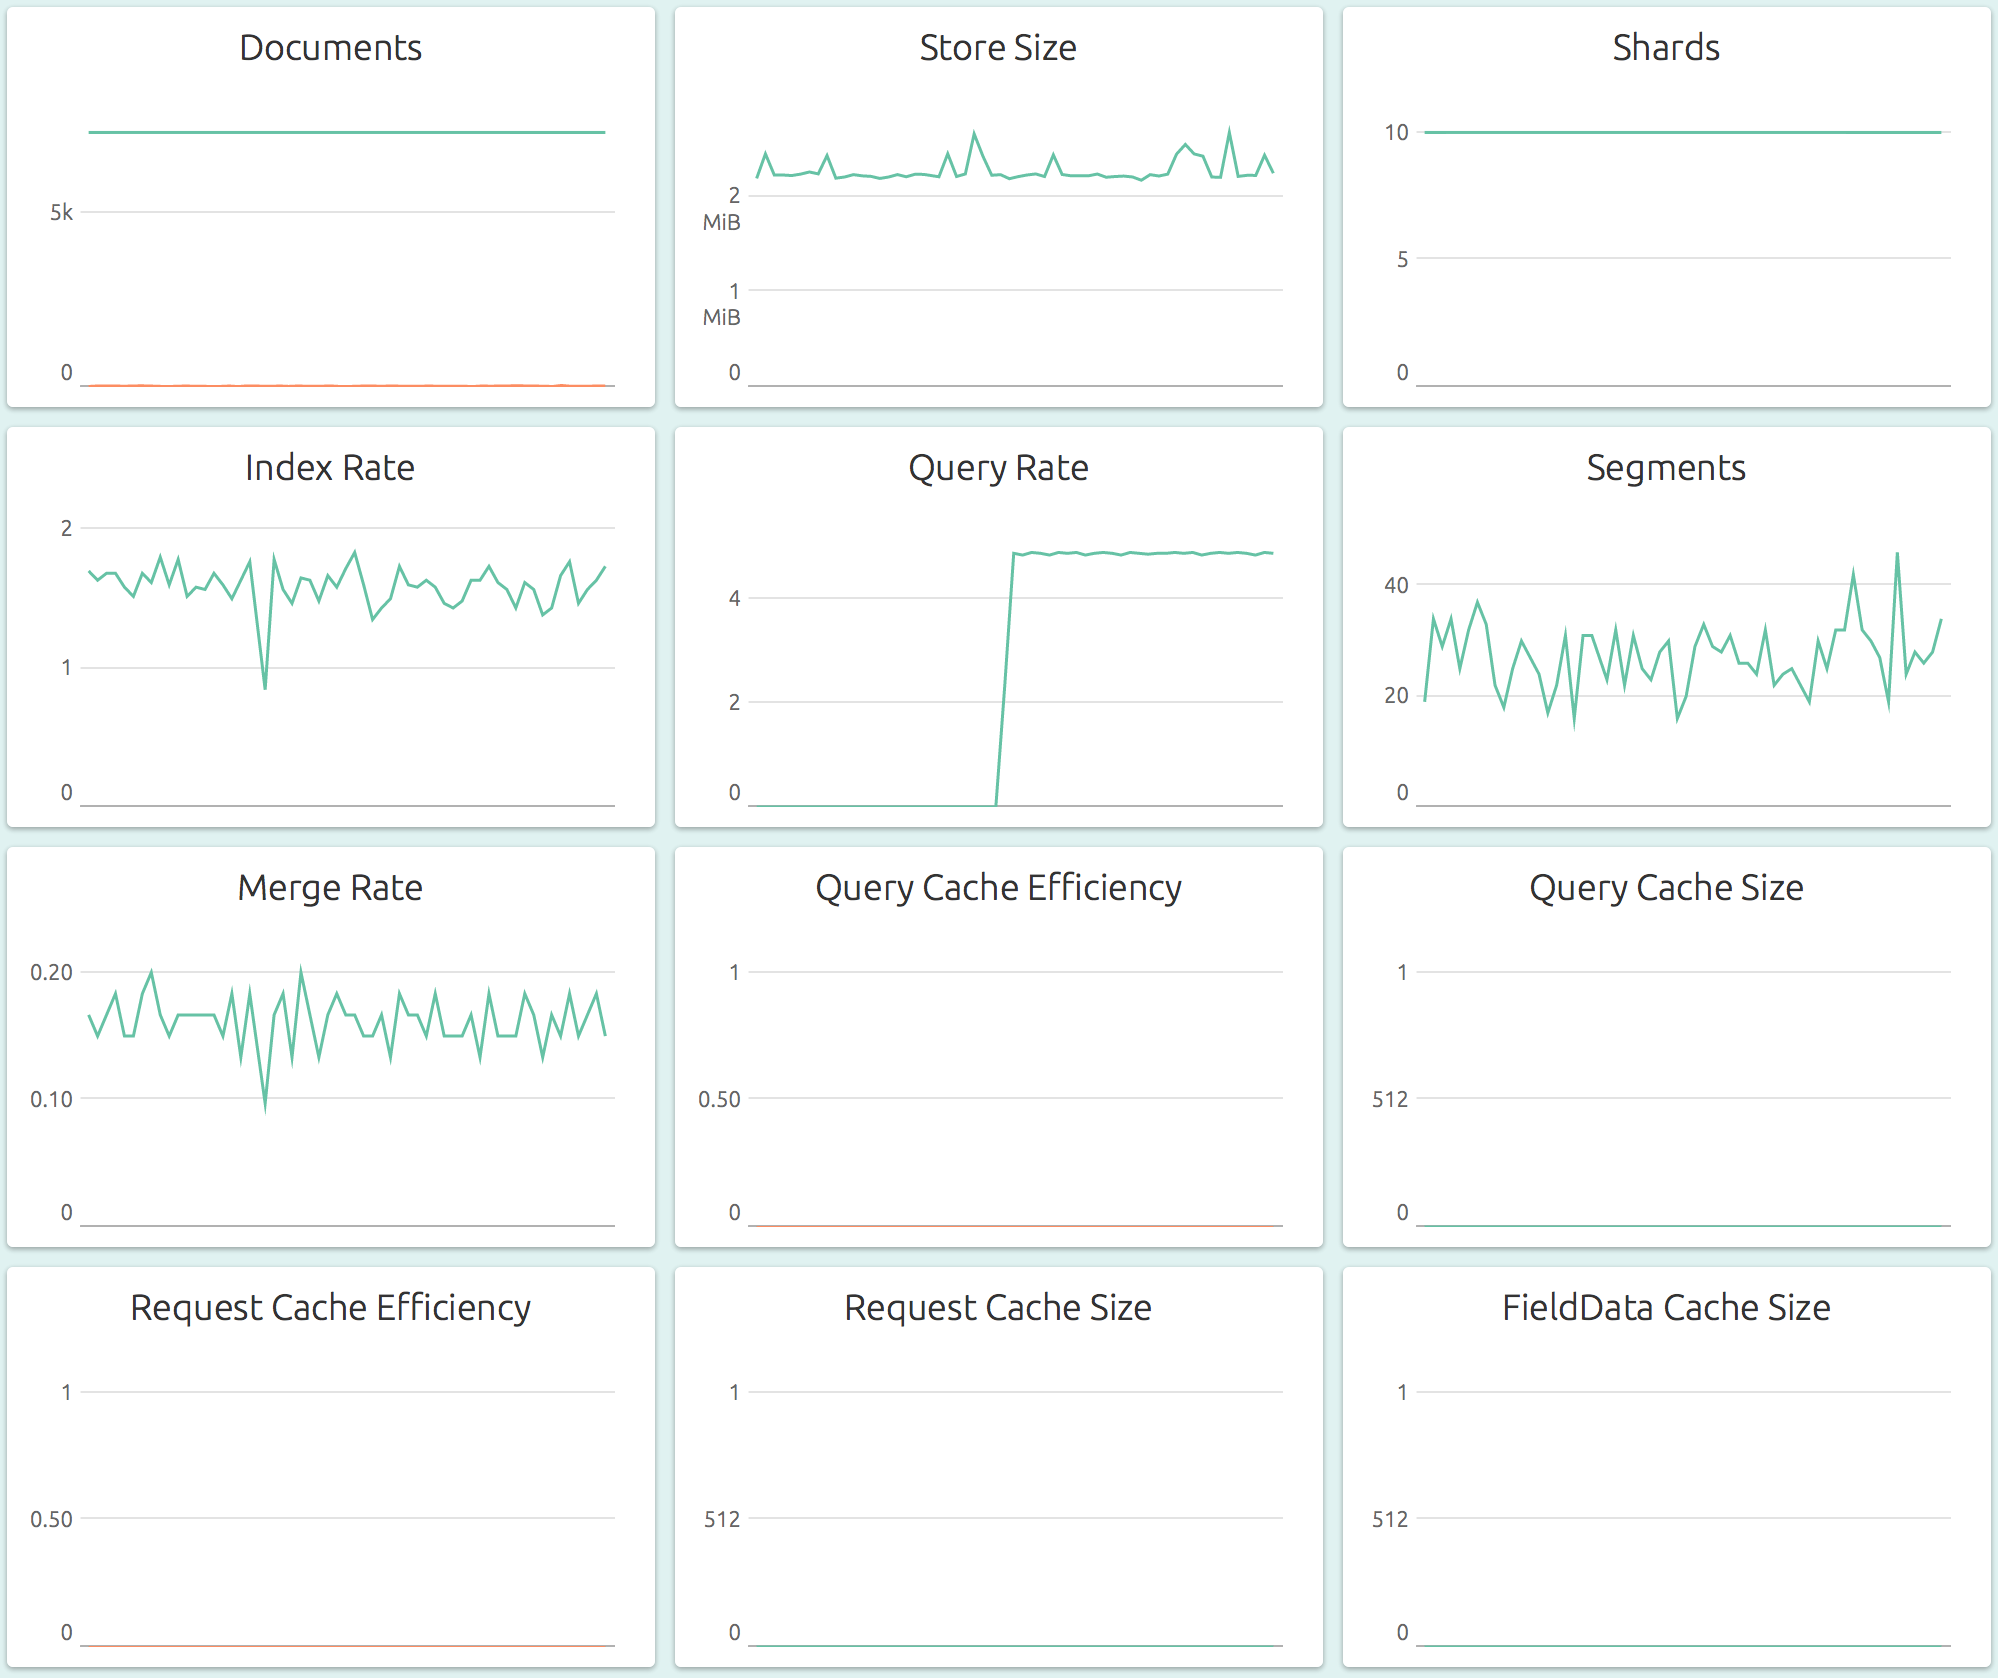
Index-specific Metrics for a detailed look at a single Elasticsearch index, including storage, segment and merge related metrics:
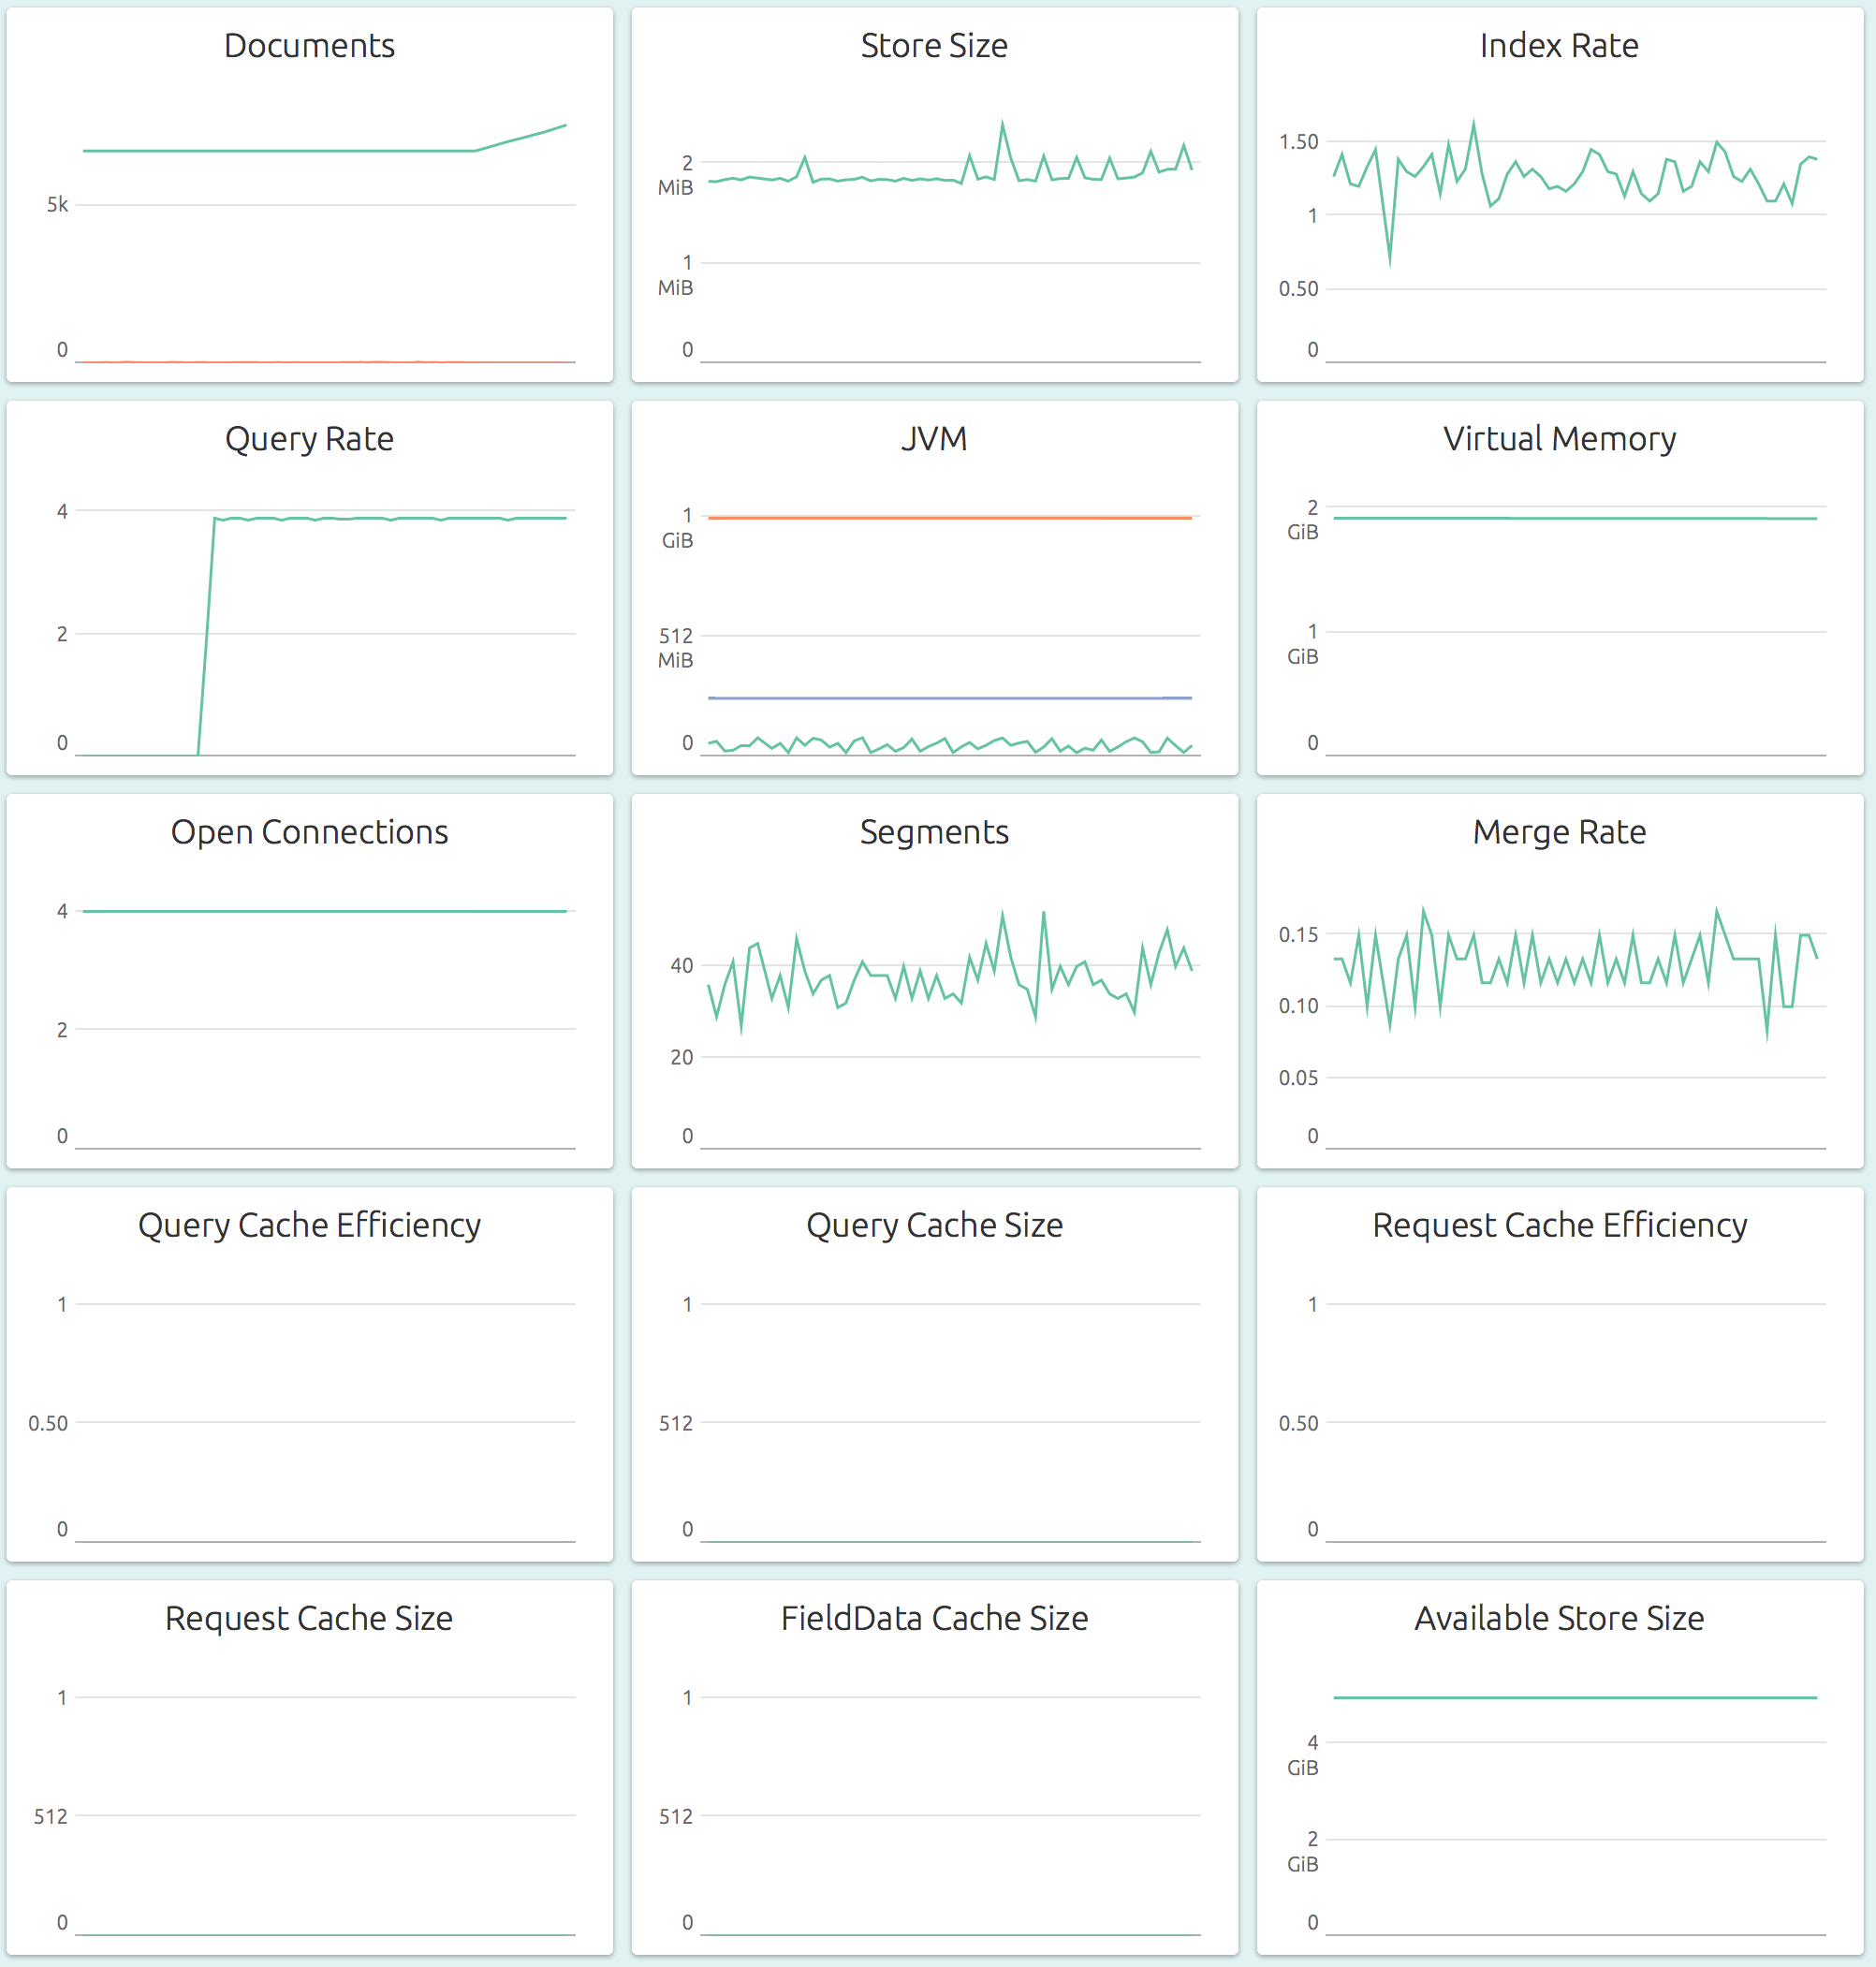
Node-specific Metrics for a detailed look at a single node of the cluster, including storage, memory usage, index and query rates and cache efficiencies of various caches:
Got Elasticsearch setup? Ready to start monitoring? Check out the OpsDash SaaS Beta! It’s free and you can be up and running with Elasticsearch monitoring in a matter of mintues. Sign Up today!
New Here?
OpsDash is a server monitoring, service monitoring, and database monitoring solution for monitoring MySQL, PostgreSQL, MongoDB, memcache, Redis, Apache, Nginx, HTTP URLs, Elasticsearch and more. It provides intelligent, customizable dashboards and spam-free alerting via email, HipChat, Slack and PagerDuty. Send in your custom metrics with StatsD and Graphite interfaces built into each agent.