How can you keep an eye on that slow SQL query? Is it taking up too much time nowadays? How about that call to the 3rd party API? Is it actually slow during the weekends? Being able to answer such questions quickly, to track these numbers in real-time, is a bit like driving at night with headlights on!
Imagine adding a new feature that you’ve tested well enough, but want to roll it out slowly in production, while keeping an eye on the time taken for a few crucial operations. Having a system where it is easy to add in these few metrics quickly, have it graphed and alerted on in real-time, provides the scaffolding for smooth, solid ops. And less weekend on-call duties.
So how do you get yourself such a system? Read on!
Measuring
This is the easiest part. Measuring the time taken to execute a piece of code typically goes like:
func (foo *Bar) Parse() error {
	t := time.Now()

	// ... do stuff ...

	elapsed := time.Since(t)
	// report elapsed
}

// or, a little more cleanly, like this:
func (foo *Bar) Parse() error {
	t := time.Now()
	defer func() {
		elapsed := time.Since(t)
		// report elapsed
	}()

	// ... do stuff ...
}
If you want to count the number of times an event occurred, you’d use something like this:
var parseFailures uint64

func (foo *Bar) Compile() error {

	if err := foo.Parse(); err != nil {
		// count the number of times this happens
		atomic.AddUint64(&parseFailures, 1)
		// ...
	}

	// ...
}
There are better ways to count and to report that count, though. Read on.
Reporting Metrics (push) vs. Collecting Metrics (pull)
How do you get the measurements out of your app and into something which can graph them? There are two approaches:
- Push: After gathering the measurement, your app reports, or “pushes” the measurements into a low-latency service, and continues with it’s work.
- Pull: Your app exposes these metrics in a standard format at a predefined endpoint. A collection service “pulls” these metrics.
There are enough examples of these in the wild. The proc filesystem mounted at
/proc and an SNMP agent that can be queried are examples of the pull model.
Google Analytics is an example of the push model.
So which one should you pick for your app? There’s no correct answer. In both cases, apart from your app, you need a service that can accept metrics or pull metrics. You should choose an approach that suits your app, scale and team.
The expvar package
Within Google, the pull approach is used,
which perhaps explains why the expvar package
exists in the Go standard library.
This library provides a way to expose your app metrics so that a service can
collect them. Rewriting the above using the expvar package makes it look like
this:
import "expvar"

var elapsed = expvar.NewFloat("parseTotalTime") // nanoseconds

func (foo *Bar) Parse() error {
	t := time.Now()
	defer func() {
		elapsed.Add(time.Since(t))
	}()

	// ... do stuff ...
}

var parseFailures = expvar.NewInt("parseFailures")

func (foo *Bar) Compile() error {

	if err := foo.Parse(); err != nil {
		// count the number of times this happens
		parseFailures.Add(1)
		// ...
	}

	// ...
}
Importing the package sets up an HTTP handler for the default HTTP server to
handle the URL path /debug/vars, and serves up your metrics as a JSON object.
You’ll need to start the default HTTP server explicitly.
Although it is convenient that this package exists in the standard library, there is not much of an (open source) ecosystem around it. Neither are there schema or conventions around the JSON format that is exposed.
If the pull approach suits you best, you might also want to take a look at Prometheus.
StatsD and Graphite
For the push model though, StatsD and Graphite are the de facto standards. There are client libraries for many languages that let you push metrics into StatsD and graphite.
You can send your measurements as plain metrics into a graphite server. A single report is simply a name, a timestamp and a value.
StatsD was designed to sit between your app and graphite, and do some aggregation of the metrics before passing it on to graphite. What’s that, you ask? Basically, StatsD hangs on to the metrics you send it, and at periodic intervals (called the “flush interval”, typically 1 minute), calculates additional information and then pushes it into graphite. Here are some things that it can calculate:
- Each time an event happens, you can send a “+1” to StatsD. It can count them, and report totalled counts.
- Each time you send a timing measurement, StatsD remembers it. At flush time, it computes percentiles, min, max and more for each timing measurement metric and forwards it to graphite.
- You can track a varying quantity (like system temperature or fan speed) as a gauge. The last value at flush time gets reported.
See this page for all the cool stuff that StatsD can compute.
Sending Data to StatsD
The StatsD on-wire text protocol is so simple it hardly needs any vendored library. Essentially, you can send text strings in this format to an UDP port. Here’s the complete source of a fully functional StatsD client:
package util

import (
	"fmt"
	"io"
	"net"
	"time"
)

var queue = make(chan string, 100)

func init() {
	go statsdSender()
}

func StatCount(metric string, value int) {
	queue <- fmt.Sprintf("%s:%d|c", metric, value)
}

func StatTime(metric string, took time.Duration) {
	queue <- fmt.Sprintf("%s:%d|ms", metric, took/1e6)
}

func StatGauge(metric string, value int) {
	queue <- fmt.Sprintf("%s:%d|g", metric, value)
}

func statsdSender() {
	for s := range queue {
		if conn, err := net.Dial("udp", "127.0.0.1:8125"); err == nil {
			io.WriteString(conn, s)
			conn.Close()
		}
	}
}
As you can see, the code is quite simple. The metrics are pushed into a channel
to allow the caller to continue ASAP. The statsdSender then writes each
measurement into a StatsD-compatible agent on localhost.
The util.Stat* functions are meant to be used from application code, like so:
func (foo *Bar) Parse() error {
	t := time.Now()
	defer func() {
		util.StatTime("parse.timetaken", time.Since(t))
	}()

	// ... do stuff ...
}

func (foo *Bar) Compile() error {

	if err := foo.Parse(); err != nil {
		util.StatCount("parse.failures", 1)
		// ...
	}

	// ...
}
If you anticipate that too many metrics might get pushed into the channel, have a look at the client-side sampling rate feature of the StatsD protocol.
StatsD and the OpsDash Smart Agent
In the code above, the metrics are pushed into a StatsD running on localhost.
For OpsDash, we actually use nearly the same code above in production, and we don’t have a StatsD on each node! The OpsDash Smart Agent includes built-in StatsD and graphite daemons. Naturally, we use OpsDash itself to monitor the SaaS version of OpsDash!
Here’s a snippet of the agent configuration file /etc/opsdash/agent.cfg:
statsd {
# You can enable the statsd interface by setting this to 1.
enabled = 1
# For timing metrics, percentiles are computed as per this list. Values
# must be comma-separated integers in ascending order. Default value is
# "90,95,99".
#percentiles = "90,95,99"
# When enabled, OpsDash will listen on *:8125/tcp and *:8125/udp for
# statsd connections. Uncomment to change the IP or port it listens on.
#bind.udp = "0.0.0.0:8125"
#bind.tcp = "0.0.0.0:8125"
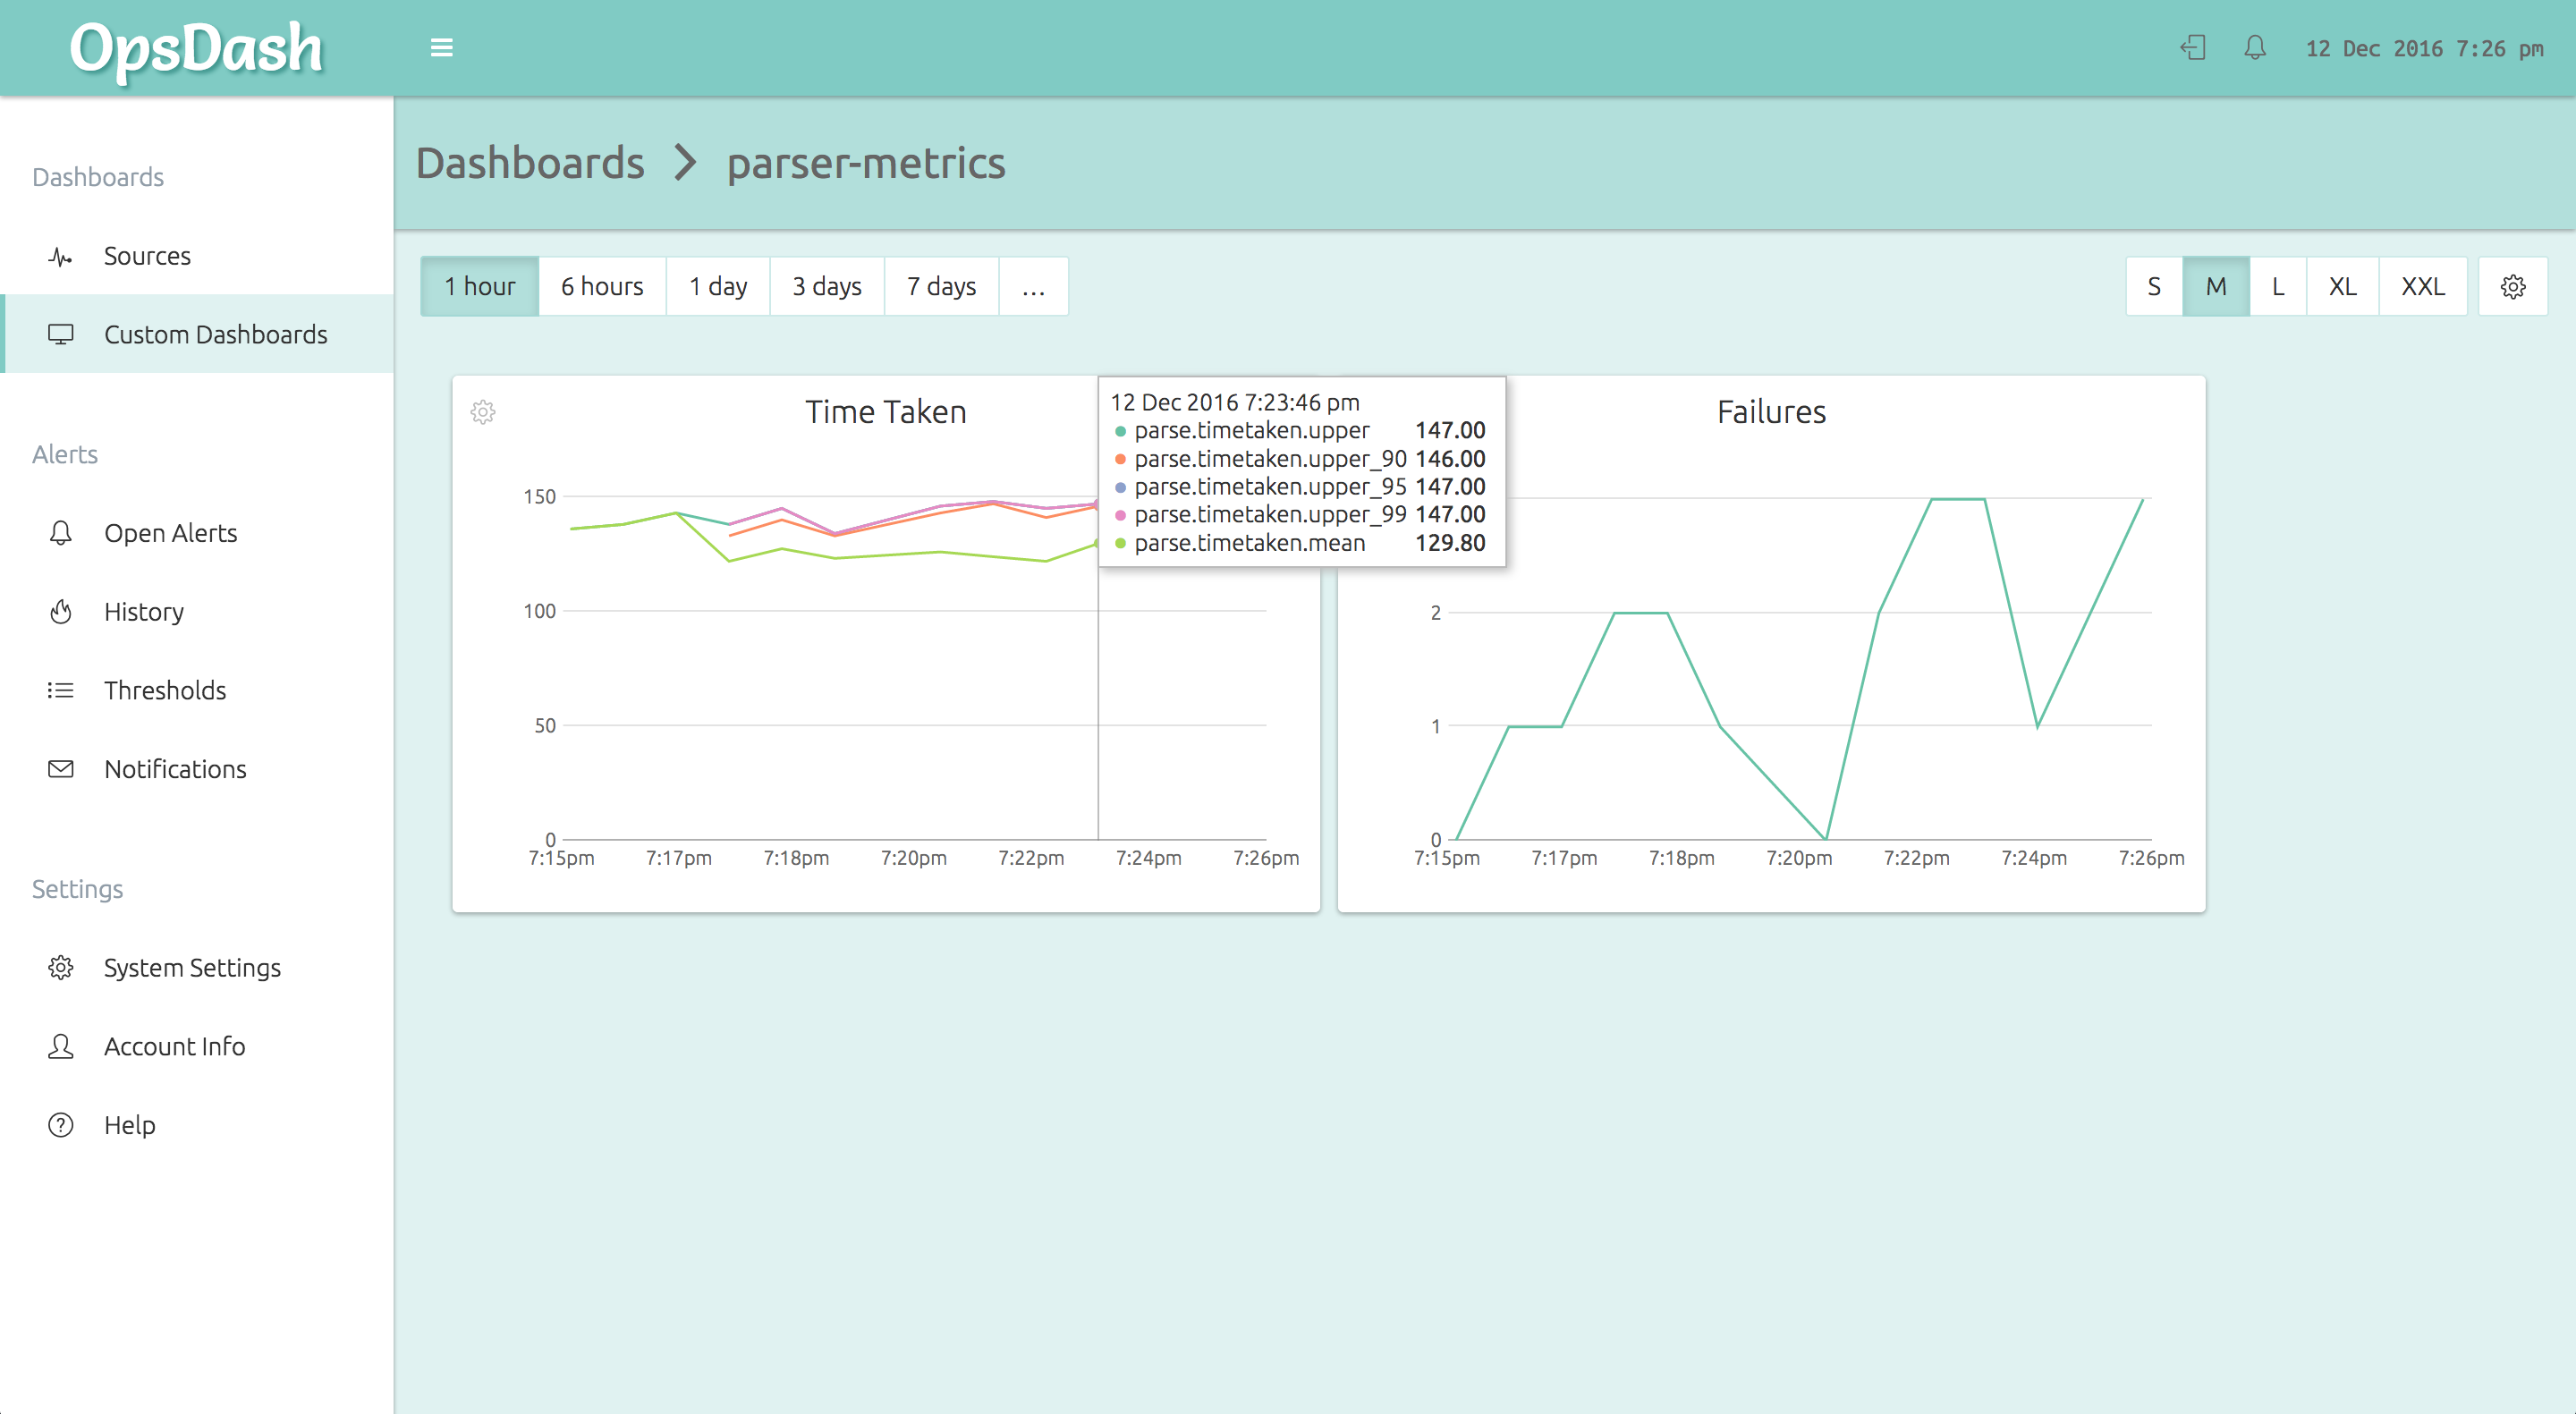
}The OpsDash Smart Agent runs on each node and accepts the StatsD metrics from the application code. It then forwards it to the OpsDash SaaS server, where it can be graphed and alerted upon. Here’s how the above metrics will look on an OpsDash custom dashboard:
Further Reading
- Google’s SRE Book has more about how they monitor their systems.
- Prometheus is an open-source pull-based metrics collection and storage system.
- StatsD was developed by Etsy. It has a great ecosystem around it.
- Graphite (full docs here) has been around for a long time. It supports storage and post-facto aggregation of metrics.
- OpsDash provides simple, powerful and affordable server and app metric monitoring. Currently in public beta. Signup here and checkout the pricing here. Free during beta.