OpsDash provides easy-to-setup MySQL monitoring that comes with a well-thought-out dashboard that displays metrics that are most relevant to the health and performance of the MySQL server being monitored.
Quick Start
You can setup a MySQL instance to be monitored by OpsDash in just a single step. From your OpsDash server UI, navigate to System Settings > Manage: Service to add a new service:
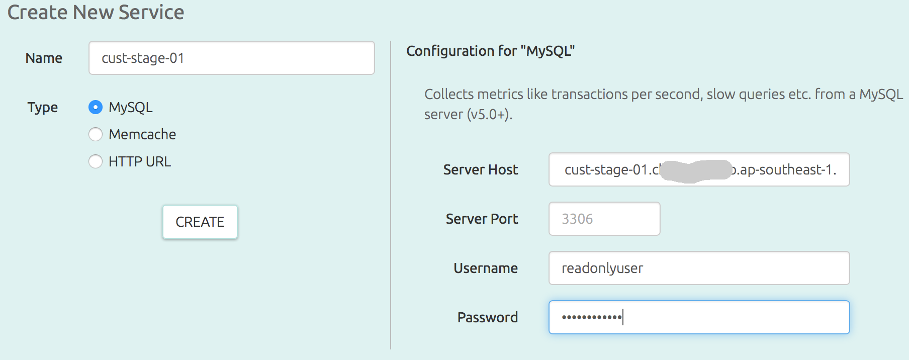
In this example, we’re connecting to an AWS RDS MySQL instance named “cust-stage-01”. The
user readonlyuser has no privileges granted to it for any database.
Hit “Create” and you’re done. You can now monitor your MySQL instance with OpsDash!
OpsDash will fetch metrics from the MySQL instance every minute. You can see the status of this operation on the same page:
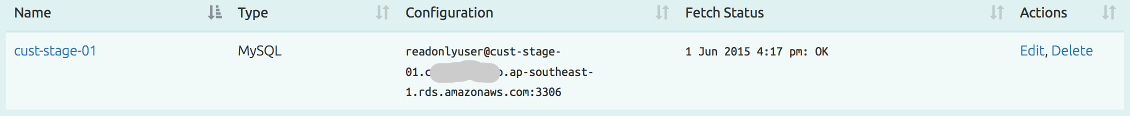
Issues like incorrect password, misspelt host name and the like can be seen directly from here, without wading through log files.
Once the fetch happens (within a minute), you can see the dashboard:
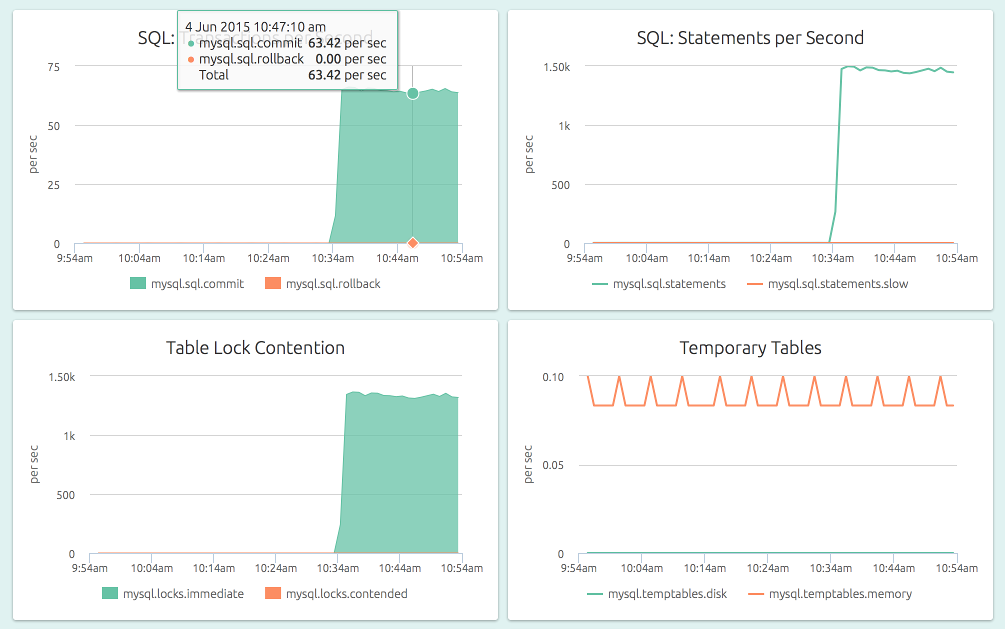
Here the MySQL instance is getting a work out from mysqlslap. You can use the size buttons on the dashboard (not visible in the screenshot) to make the graphs a little smaller to see all of them – this view works well if you’re familiar with the patterns and just want to view this on a wall monitor.
Intelligent Dashboards
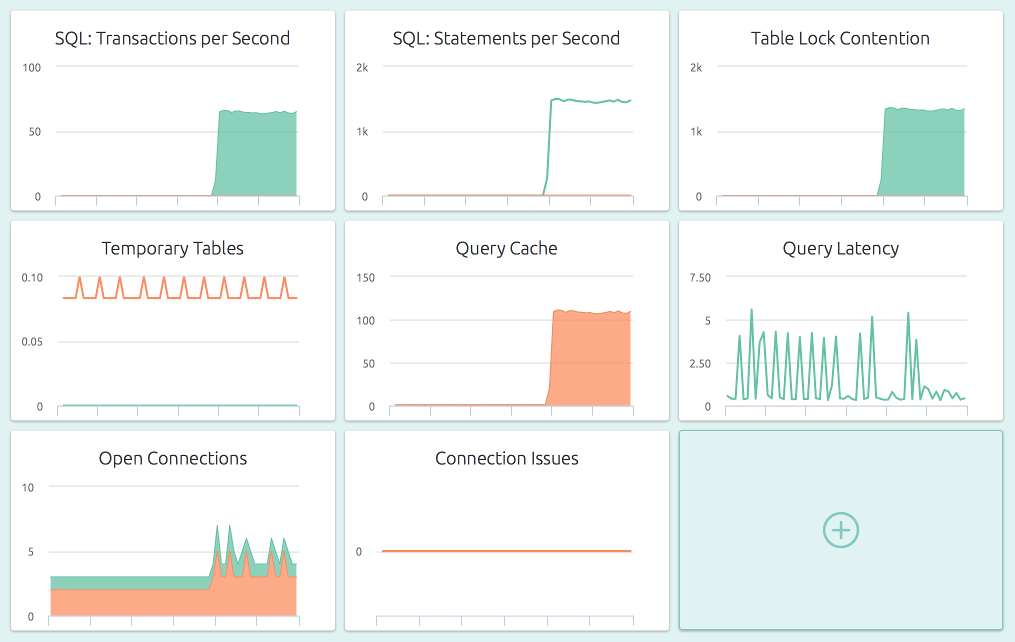
The metrics shown in the dashboard are carefully selected, graphed and ordered so as to give out as much information as possible, with just a quick look at the screen. They are also the right indicators to set thresholds on, to detect abnormal behavior. These are the graphs:
- Transactions per Second (TPS): The total transactions, with individual series for commits and rollbacks, across all databases.
- Statements per Second: The number of statements being executed per second, and importantly, how many “slow” ones.
- Table Lock Contention: Are there transactions waiting to get exclusive access to a contented table? Check how many locks happen per second, and how many of them are contended.
- Temporary Tables: The number of on-disk and in-memory temporary tables that are being created every second. Reducing these numbers by optimizing your SQL queries generally result in improved throughput.
- Query Cache: A measure of the efficiency of MySQL’s internal query cache.
Helpful in tuning the values for
query_cache_*variables and getting the maximum benefit from your DB server RAM. - Query Latency: The time taken to execute a single
SELECT 1statement. If your client is experiencing elevated query times, this can be used to check if the culprit is an overloaded server or network. - Open Connections: The currently running and sleeping connections.
- Connection Issues: The number of client aborts (clients close their connection to the server un-gracefully) and the number of connect failures (invalid credentials). Increases in aborts typically indicate bad code that is ill-written or crashing, and connect failures typically indicate people trying to break-in!
For a stable database server, these graphs should follow a predictable cycle, based on your workload and traffic. By setting thresholds, you can easily catch, say a bad release, where the code now does many more transactions than before. Or someone trying out brute-force password searches.