OpsDash is a next-generation, self-hosted server- and service-monitoring, dashboarding and alerting solution. It’s written entirely in Go, which gives it a light memory and resource footprint.
To show what we mean by light, we setup an OpsDash server on the lowest end Digital Ocean node that we can get – a 512 MB RAM, 1 CPU, 20 GB HDD VM that costs a mere $5 a month. We also took another such node and ran 100 agents on it, all running independently and querying and reporting the same stats to the server. The names are suffixed by “-{number}” to distinguish them.
And how did it look? Let’s check the graphs on the OpsDash server:
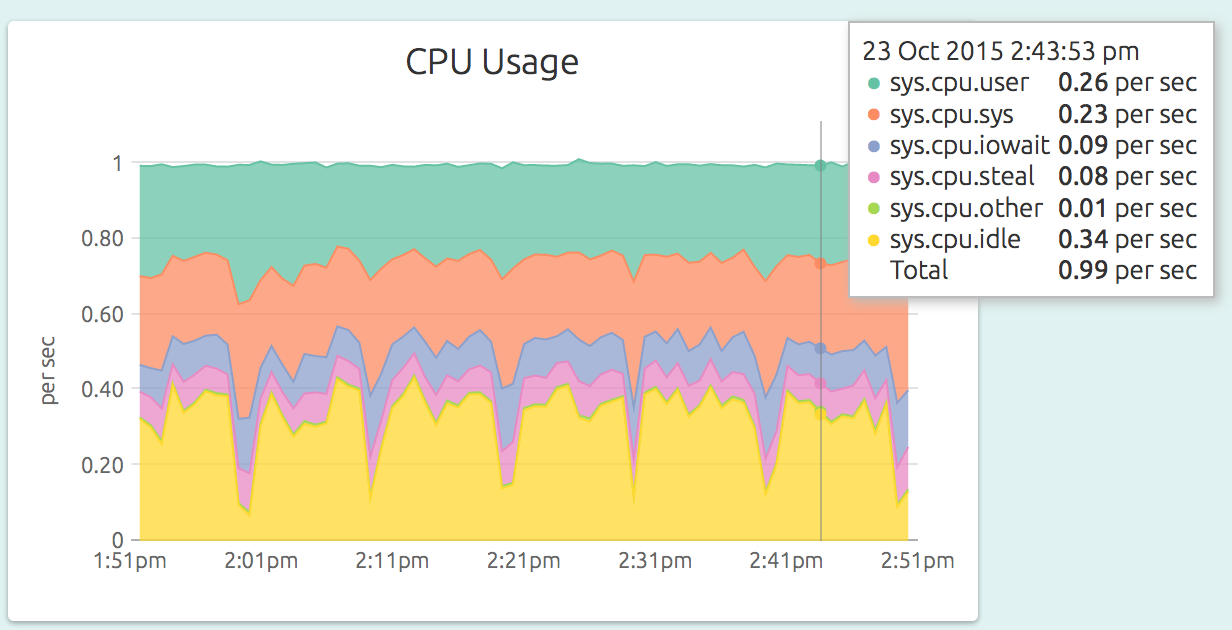
Well, mostly 34% idle! And what about the memory?
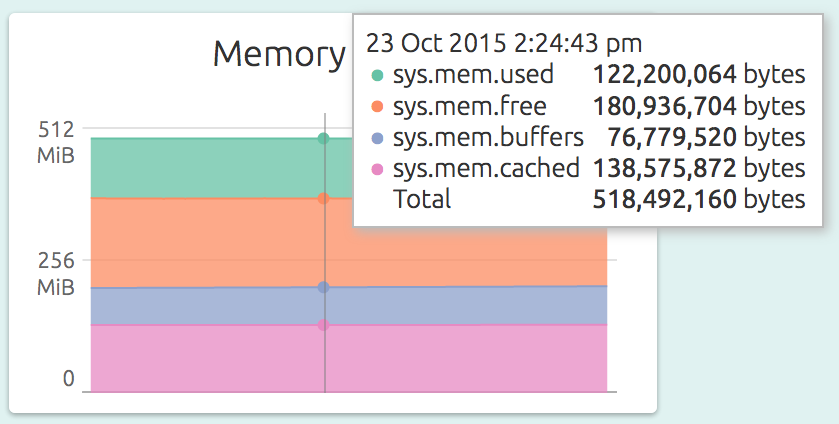
That’s only 122MB in use! Remember it also serves up the whole HTTP UI too. Not bad, eh? What about the agent?
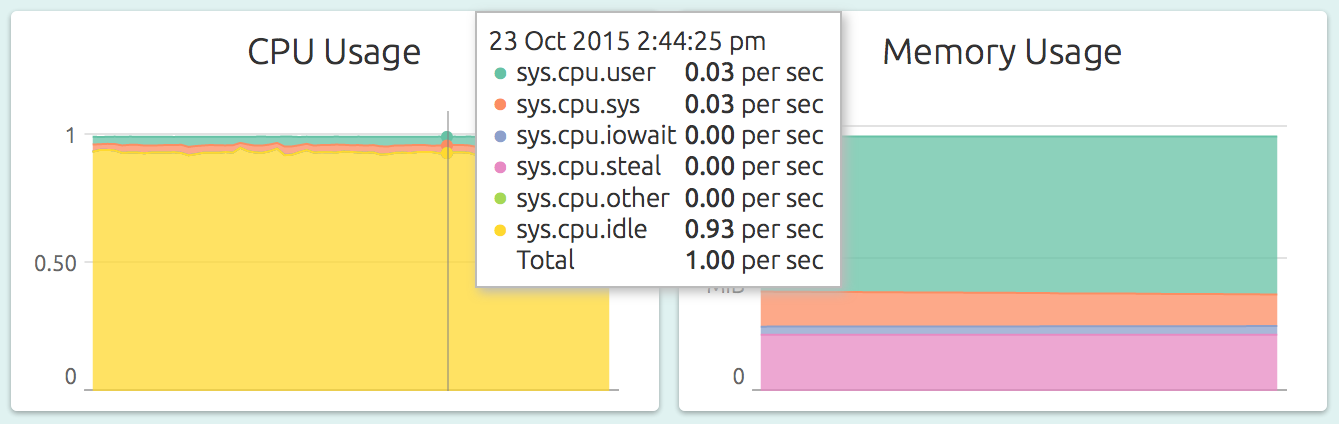
That’s not one, but 100 agents. At 7% CPU and 320 MB memory usage. Enough room left over to run the stuff the server is supposed to run.
What about storage for the metric data?
At an average, amortized rate a typical agent contributes 1.2 MB worth of data per day. This varies a bit with the node the agent runs on, but is good enough for a rough calculation. At this rate, with 18GB of HDD, you can retain around 5 months (153 days) of data for each of the 100 servers.
It’s live!
And you know what, we left the whole thing running so you can see for yourself. Check out the demo right here!
Try OpsDash Today!
OpsDash brings you the whole package – neat clutter-free dashboards, spam-free alerting via many channels, and a 5 second install at an affordable price of $1/server/month. Oh and did we say you can also monitor Redis, Memcache, MongoDB, PostgreSQL, MySQL and more too?
Prevention is cure! Start monitoring your servers with OpsDash today – no more excuses!