rtop, rtop-bot and rtop-vis are lightweight, easy-to-use open source monitoring tools that are worth adding to your DevOps BatBelt! They are all written in Go, on GitHub, and easy to hack away at.
rtop
Rtop is “remote top”, similar to what top is for the local machine. You can
invoke rtop with a simple
$ rtop remote.hostwhere remote.host is something you can ssh remote.host into. You should
see something like this:

Rtop connects to the remote machine via SSH, runs commands on that machine to gather metrics and displays them like you see above. It repeats this periodically, while keeping the connection open. The commands it runs are standard Linux commands, and should be available in nearly all modern Linux distros – which means absolutely nothing needs to be installed on the machine you’re monitoring.
Rtop also knows about ~/.ssh/config. If you (like most
of us!) have a long config file and many private keys lying around in
~/.ssh, this becomes a very convenient feature. Rtop can also talk to
ssh-agent if you’re running one.
To be fair, top can also be run over SSH:
$ ssh -t remote.host topHowever, Rtop collects more metrics and displays them cleanly. It is also more hackable than top – it is very easy to fork it and add a custom monitor specific to your app. The 1,200+ stars and 50+ forks on github say it’s hackable!
rtop-bot
How about letting anyone on the team check the status of the servers when needed? Rtop-bot is a bot for Slack and HipChat that can do what Rtop can, when demanded to do so over the chat.
It does not keep updating the information, but just responds with the current values. Here’s how it looks:
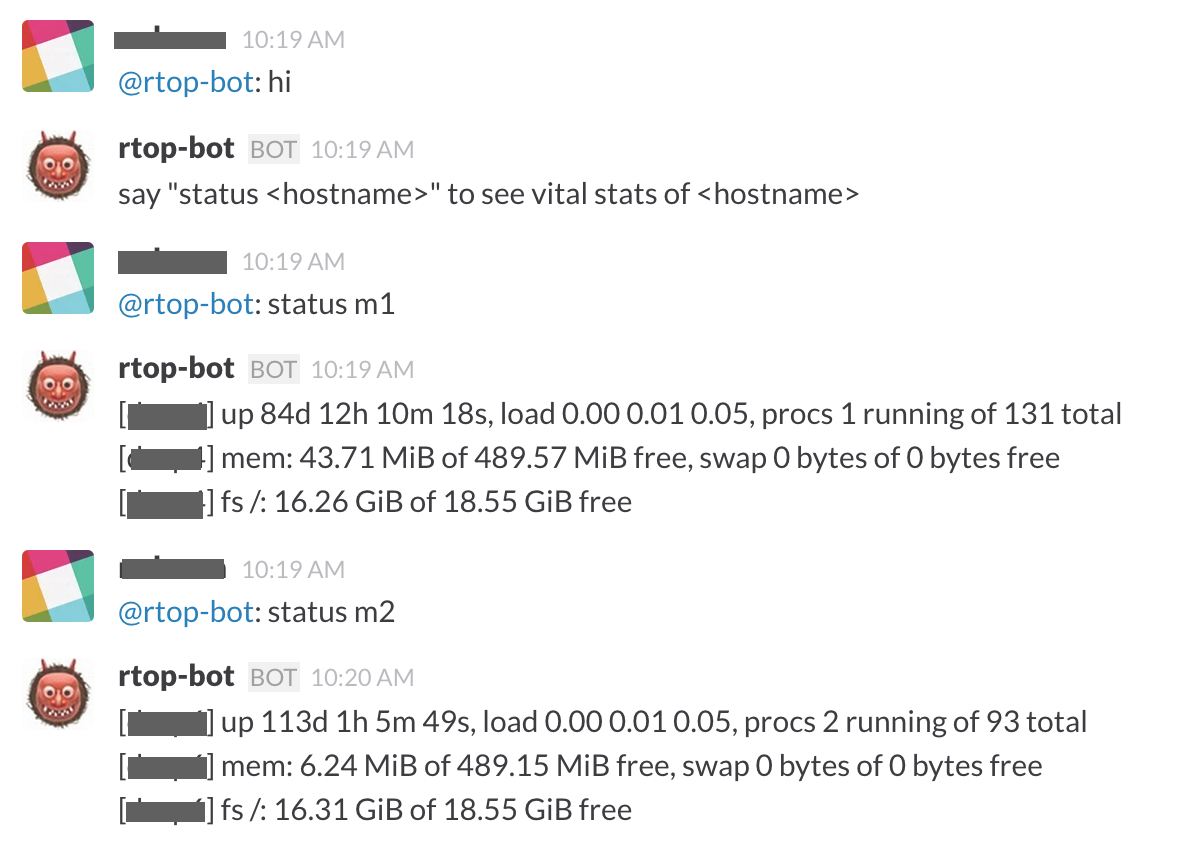
It’s an easy way for anyone to check the stats, without needing to grant everyone access or share passwords. It can be run just like Rtop, and it too knows about ~/.ssh/config and ssh-agent.
rtop-vis
Rtop-vis lets you monitor a bunch of servers in parallel, and shows the metrics as time-series graphs over a built-in web server. It’s easier to see this with a screen shot:
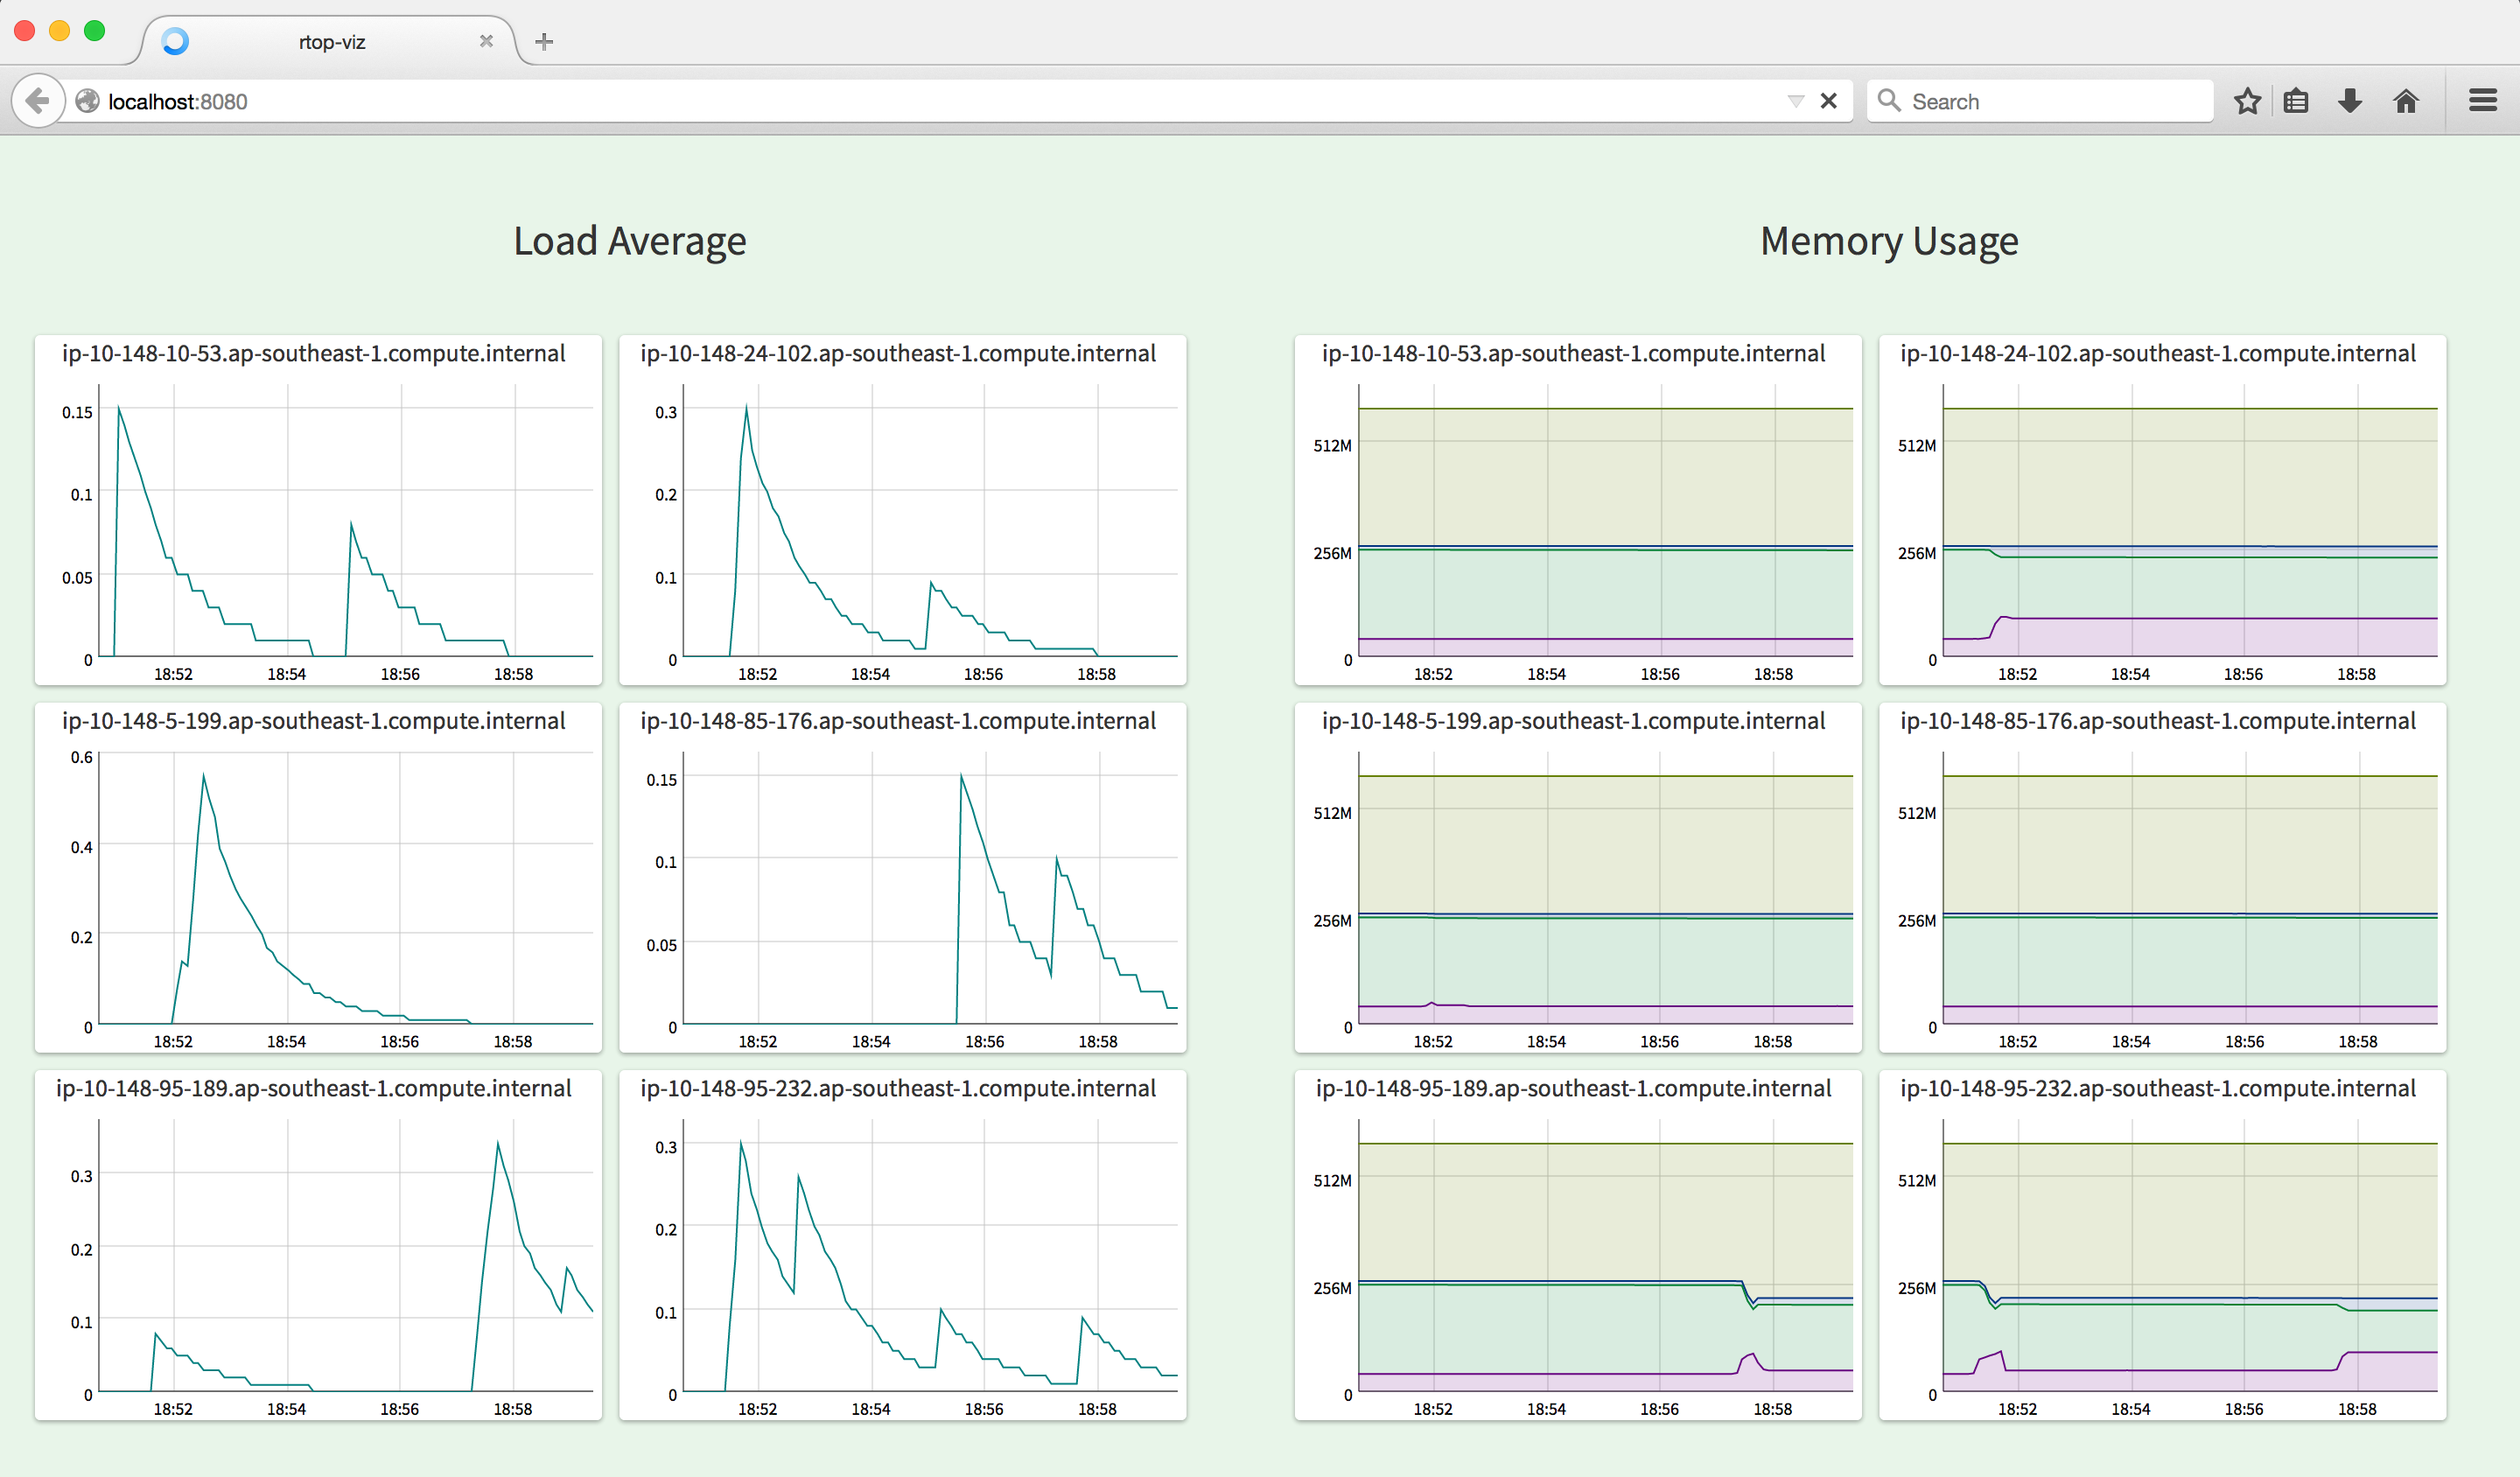
It shows only the load average and memory usage for each machine. Rtop-vis is mainly useful in monitoring the load of a cluster of, say web nodes, during unusual traffic patterns.
The web server provided by Rtop-vis is fully self-contained, and requires no setup (thanks, Go!). Like the other two tools, Rtop-vis is also just run from your command-line.
RapidLoop
These tools are MIT-licensed open source software, brought to you by RapidLoop. Our server and service monitoring product, OpsDash, is built with Go and uses many OSS components. These tools are our way of giving back to the open source community.
Subscribe to our newsletter for updates on additions to the rtop suite, monitoring best practices, cool ways to use Go, OpsDash, and more!
Here are some links to get you started with the rtop suite: