OpsDash makes it easy to monitor your MySQL servers, including replication at both master and slave instance sides.
Here’s how OpsDash’s curated dashboards come out of the box:
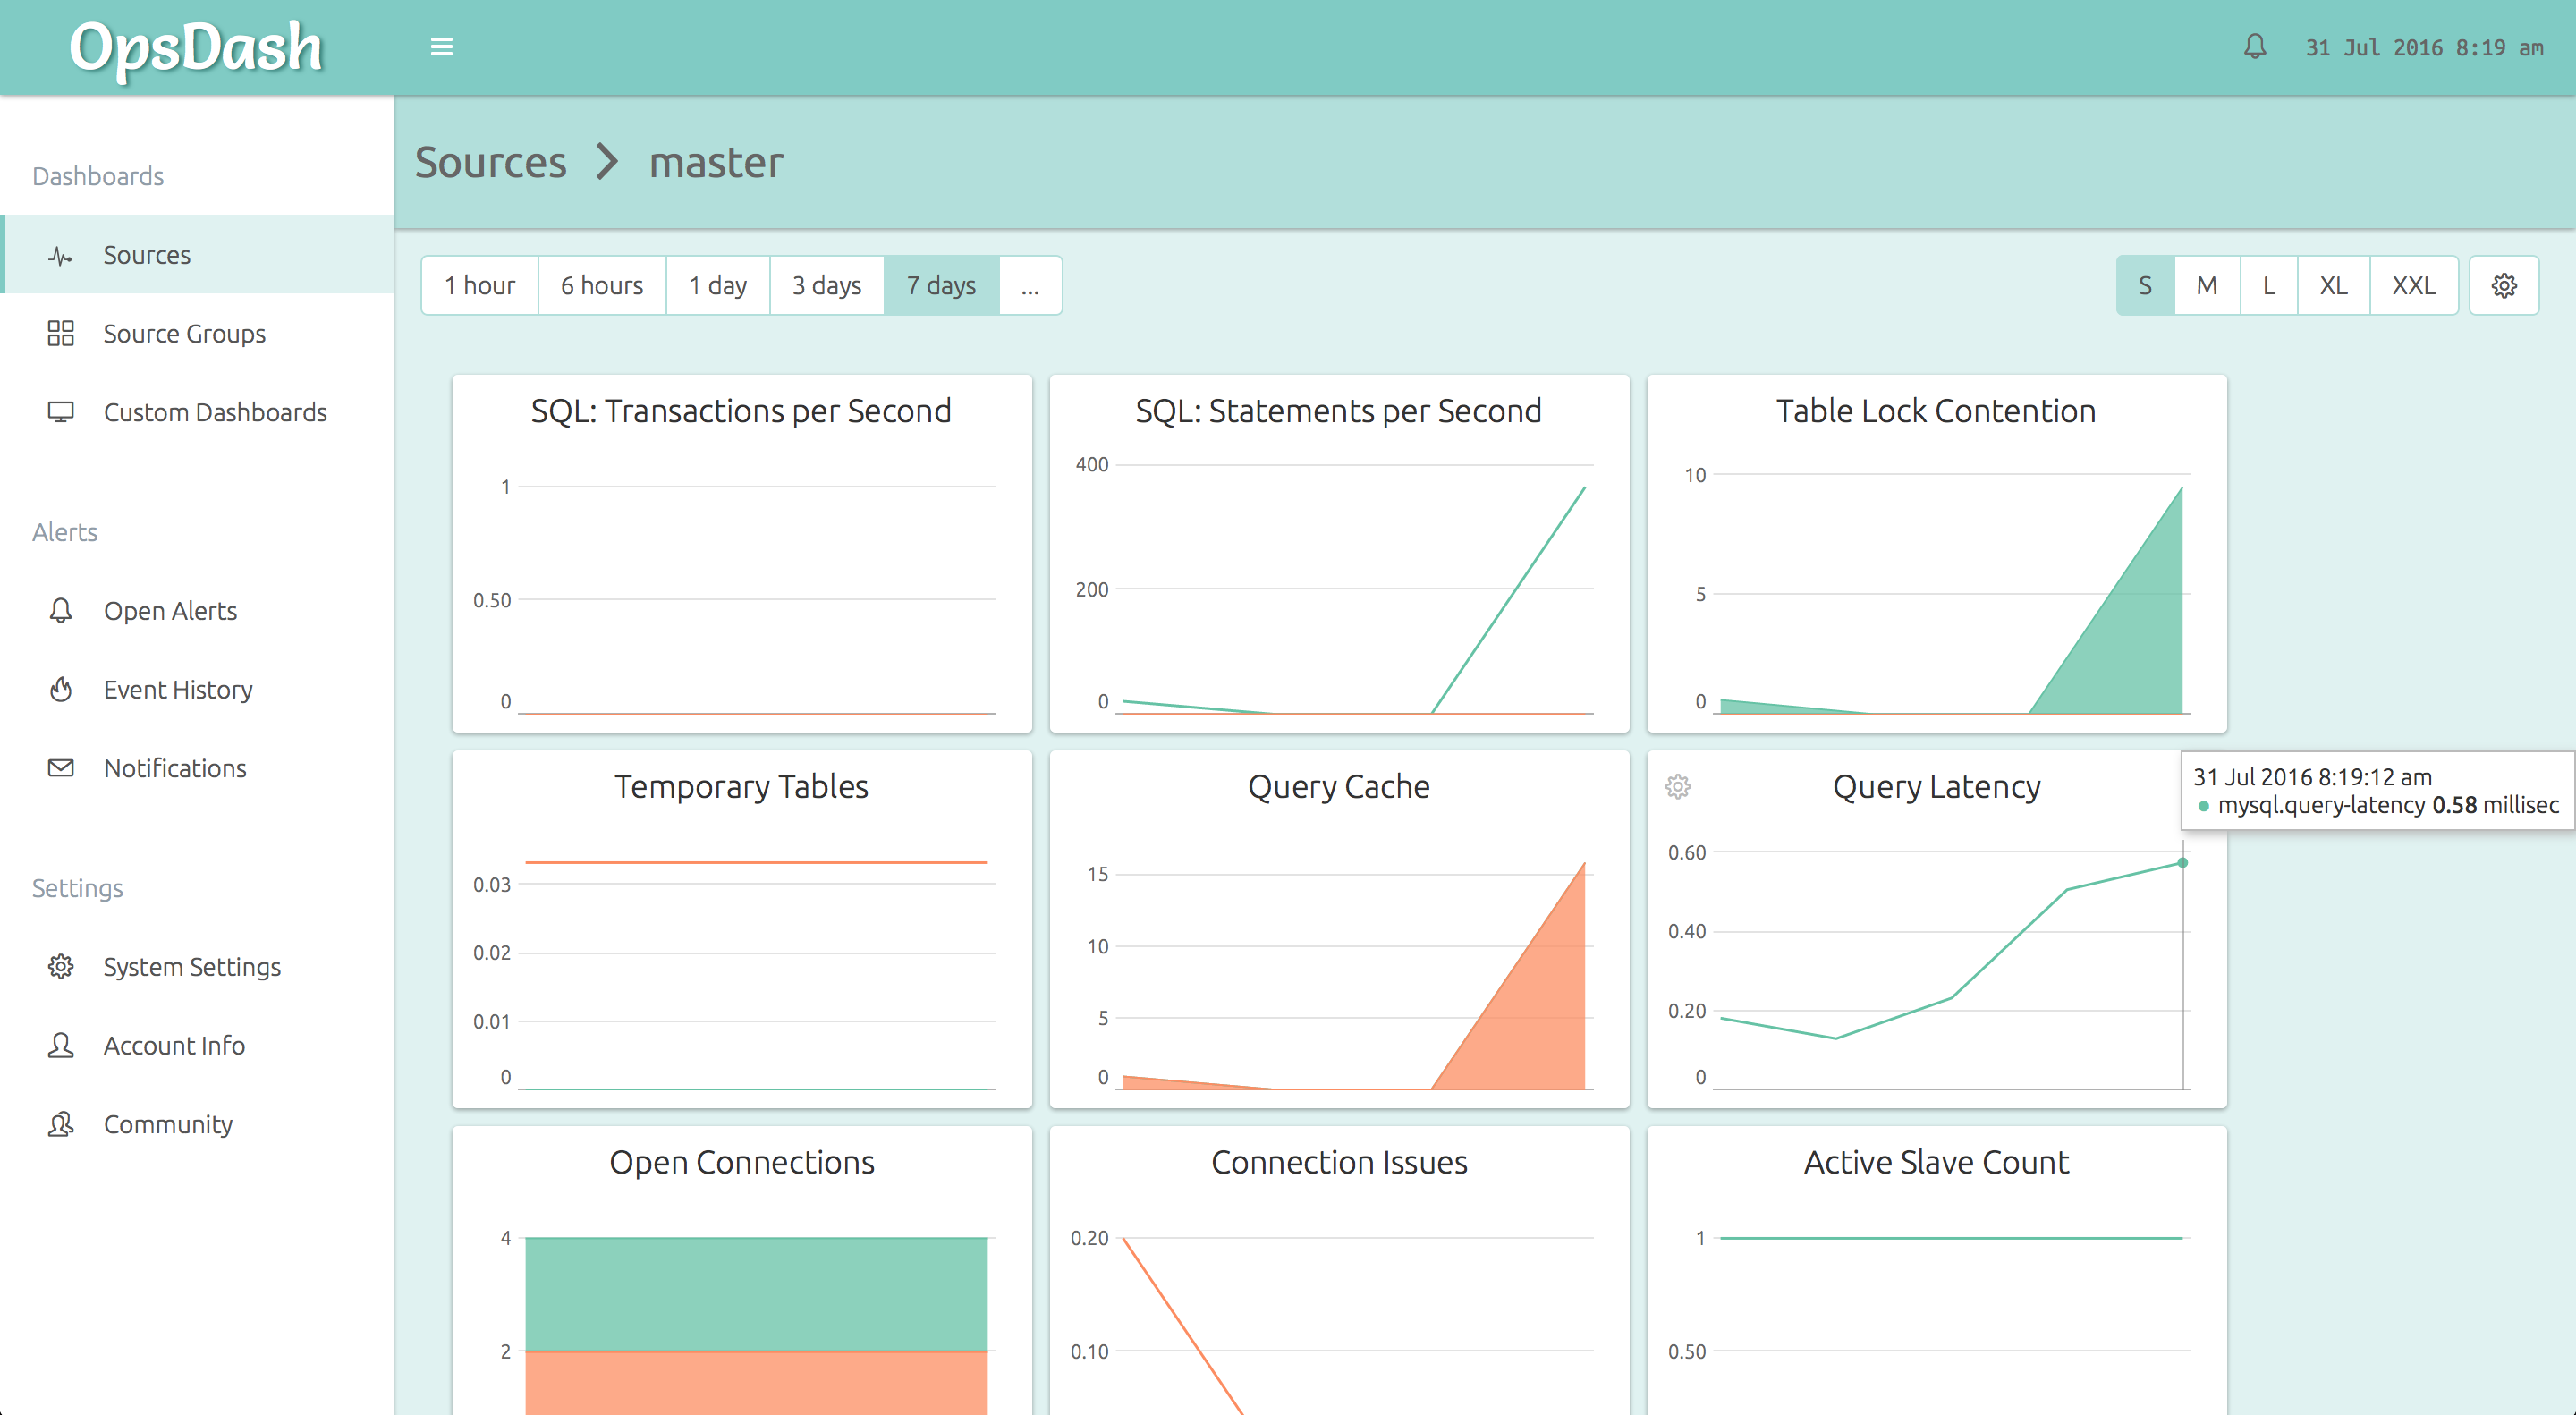
You can go from 0 to this in just a minute or two!
No messing around with individual metrics, figuring out which of them are important, no editing graph templates. OpsDash comes with smart, sensible defaults for everything which you can customize later on.
Typically, all that’s needed to ensure effective monitoring is to observe the data for a while and set alerts to notify you via Email, Slack, HipChat or PagerDuty if things go wrong.
The OpsDash Smart Agent
To get started, signup for a free OpsDash account and install the OpsDash Smart Agent. The agent is a zero-dependency, single-binary package available in many formats, including from our APT and YUM repositories. It is available for 64-bit Intel, 32-bit Intel, ARMv6, ARMv7 and ARMv8 platforms.
See here for detailed instructions on installing the agent.
Configuring
We recommend creating a separate user for OpsDash to connect and get at the MySQL metrics. You can create a user like so:
mysql> CREATE USER opsdash@localhost IDENTIFIED BY 'p@ssw0rd';
Query OK, 0 rows affected (0.00 sec)

mysql> GRANT PROCESS, REPLICATION CLIENT ON *.* TO opsdash@localhost;
Query OK, 0 rows affected (0.00 sec)
OpsDash needs the PROCESS and REPLICATION CLIENT privileges to query the status of replication.
You can then edit the configuration file at /etc/opsdash/agent.cfg
to tell OpsDash to monitor the MySQL server.
service "master" {
    type = "mysql"
    host = "127.0.0.1"
    user = "opsdash"
    pass = "p@ssw0rd"
}
Here we are assuming the agent is installed on a MySQL master instance, being replicated to another instance.
Now ask the agent to reload the configuration:
$ sudo service opsdash-agent reloadNote that if you haven’t started the agent yet, you’ll need to start it
instead of reload-ing it.
Repeat the process on the slave node.
The Graphs Explained
Here are the graphs that are present by default in your MySQL dashboards, with a brief explanation of each:
- Transactions per Second (TPS): The total transactions, with individual series for commits and rollbacks, across all databases.
- Statements per Second: The number of statements being executed per second, and importantly, how many “slow” ones.
- Table Lock Contention: Are there transactions waiting to get exclusive access to a contented table? Check how many locks happen per second, and how many of them are contended.
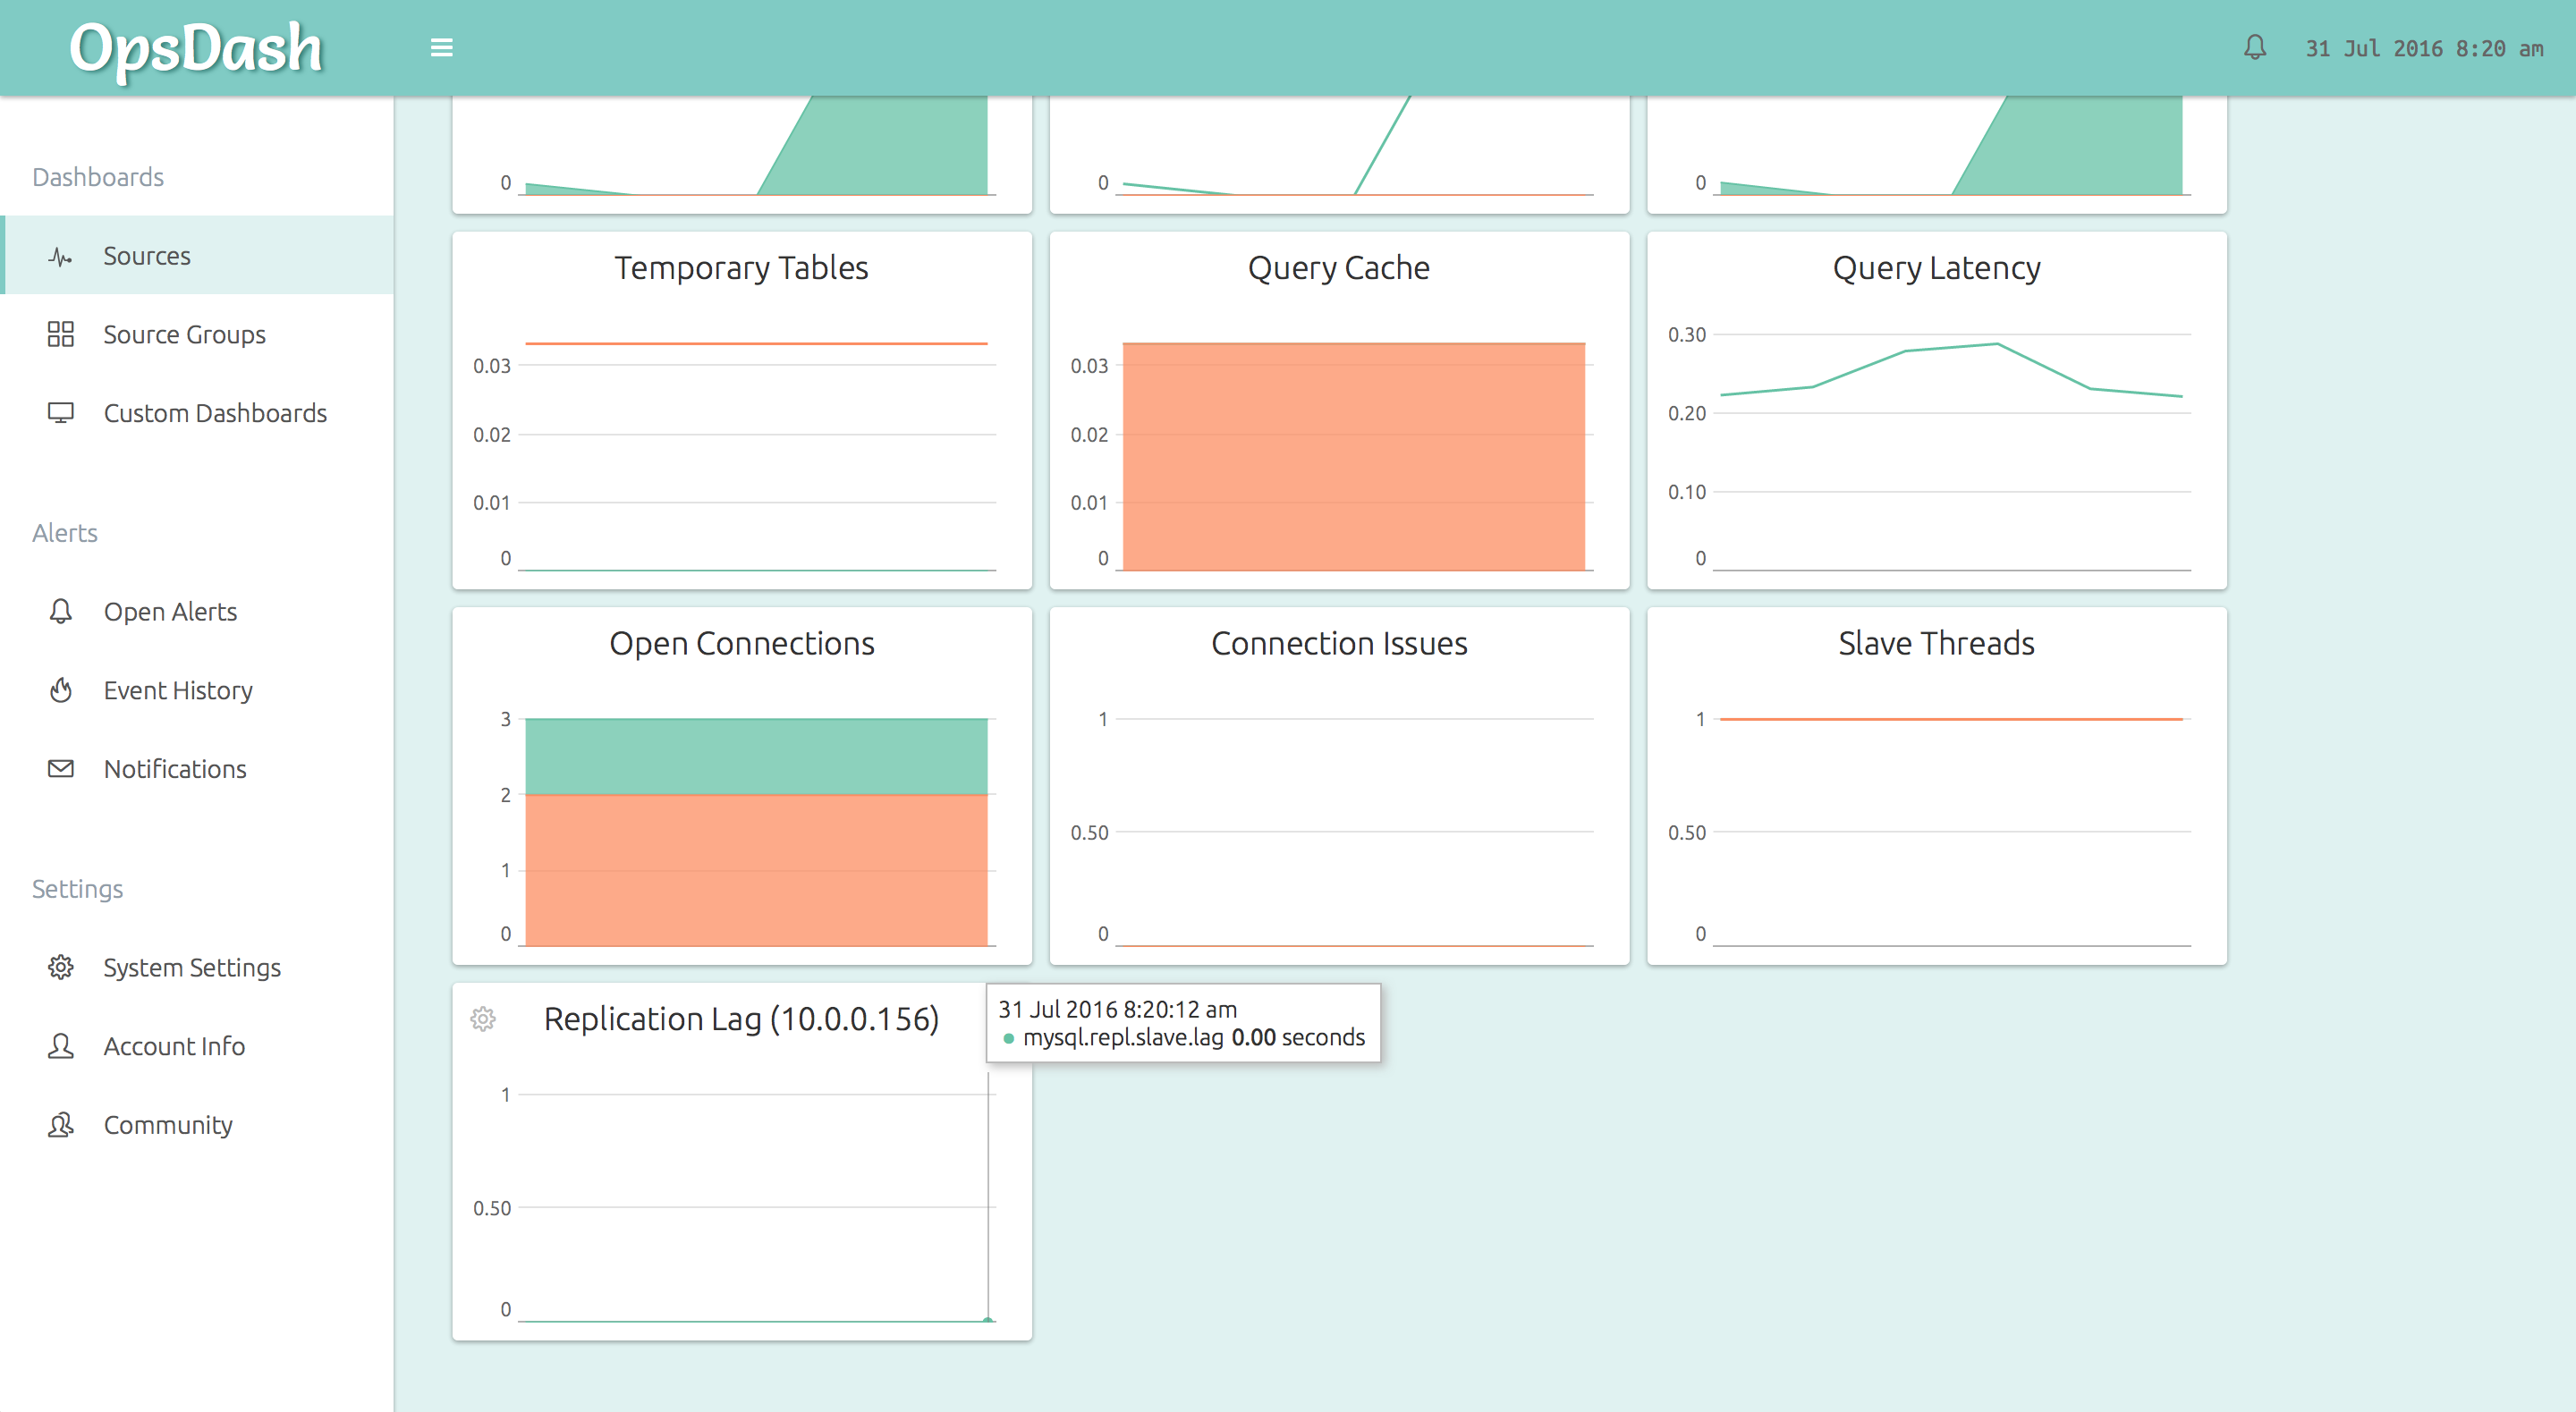
- Temporary Tables: The number of on-disk and in-memory temporary tables that are being created every second. Reducing these numbers by optimizing your SQL queries generally result in improved throughput.
- Query Cache: A measure of the efficiency of MySQL’s internal query cache.
Helpful in tuning the values for
query_cache_*variables and getting the maximum benefit from your DB server RAM. - Query Latency: The time taken to execute a single
SELECT 1statement. If your client is experiencing elevated query times, this can be used to check if the culprit is an overloaded server or network. - Open Connections: The currently running and sleeping connections.
- Connection Issues: The number of client aborts (clients close their connection to the server un-gracefully) and the number of connect failures (invalid credentials). Increases in aborts typically indicate bad code that is ill-written or crashing, and connect failures typically indicate people trying to break-in!
- Active Slave Count (master only): The number of slaves that are actively replicating from the master currently. Should be equal to the number of warm, failover-ready slaves that you’ve setup – be sure to set an alert.
- Slave Threads (slave only): The number of slave I/O and SQL threads currently running. Typically both should be 1, unless you deliberately pause them like this.
- Replication Lag (slave only): The replication lag is the number of seconds that the SQL thread of the slave is behind processing the master binary log. An increasing replication lag is a cause for concern.
New Here?
OpsDash is a server monitoring, service monitoring, and database monitoring solution for monitoring MySQL, PostgreSQL, MongoDB, memcache, Redis, Apache, Nginx, HTTP URLs, Elasticsearch and more. It provides intelligent, customizable dashboards and spam-free alerting via email, HipChat, Slack, PagerDuty and PushBullet.