Want a quick benchmark of the network link between two servers? Compare the private networking feature offered by your favorite cloud providers? Wondering how much overhead a VPN adds?
Try qperf. It’s a quick, easy way to check TCP and UDP bandwidth and latencies
between two servers.
Installing qperf
On CentOS/RHEL 7, qperf is available from the EPEL repository. Install it
like this:
# enable the EPEL repo
$ sudo yum install epel-release

# install the package itself
$ sudo yum install qperf
The Ubuntu/Debian repositories do not have qperf, so you’ll need to build it
from source. This is thankfully quite easy:
# get the tools needed to build qperf
$ sudo apt-get install -y make gcc libc-dev

# download the qperf source tarball
$ wget https://www.openfabrics.org/downloads/qperf/qperf-0.4.9.tar.gz

# unpack it
$ tar xvf qperf-0.4.9.tar.gz

# build it
$ cd qperf-0.4.9
$ ./configure
$ make

# the qperf binary is now at qperf-0.4.9/src/qperf
Using qperf
You need to run qperf on two machines. On the first one, qperf is run
in a “server” mode and on the second one, qperf can be invoked to run
various tests.
Running qperf without any arguments starts it in server mode. On the second
node, invoke it with the IP of the first server, and the test(s) to run. The
tests we are interested in are:
- tcp_bw and udp_bw – the rate of transfer over TCP and UDP, reported at byte-level (MB/s) and packet-level (messages/sec)
- tcp_lat and udp_lat – the average per-hop time taken for a TCP or UDP packet
By default qperf runs each specified test for 2 seconds. Add a -v flag to
get a verbose output. Here it is in action:
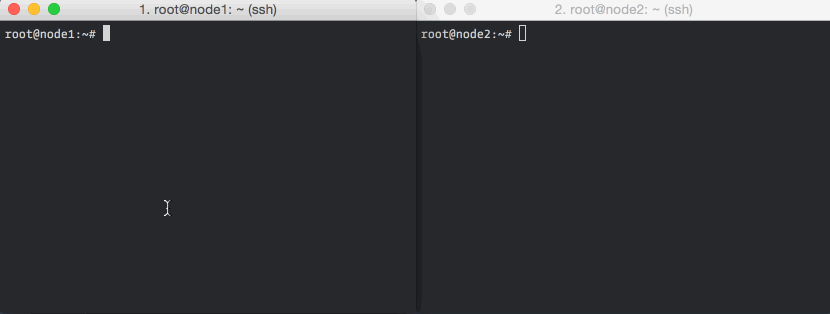
The above screencast shows the execution of the tcp_bw and tcp_lat tests. The first node (node1), with the IP 10.99.0.1, is running qperf in the server mode.
Here is a sample output of the UDP bandwidth and latency tests (you can list any or all tests in the same command line):
root@node2:~# qperf -v 10.99.0.1 udp_bw udp_lat
udp_bw:
    send_bw         =   248 MB/sec
    recv_bw         =   238 MB/sec
    msg_rate        =  7.25 K/sec
    send_cost       =   302 ms/GB
    recv_cost       =   547 ms/GB
    send_cpus_used  =   7.5 % cpus
    recv_cpus_used  =    13 % cpus
udp_lat:
    latency        =  46.7 us
    msg_rate       =  21.4 K/sec
    loc_cpus_used  =  11.5 % cpus
    rem_cpus_used  =    10 % cpus
You can also see the CPU that qperf had to consume to send and receive the
data that it did. You can also see an even more detailed output with the
-vv flag.
Instructing qperf to run the tests for a longer time, say 60s, reduces the
influence of outliers (qperf only reports averages, and no other stats). You can
do this by using the -t NN flag, like so:
root@node2:~# qperf -t 60 -v 10.99.0.1 tcp_bw tcp_lat
tcp_bw:
    bw              =   239 MB/sec
    msg_rate        =  3.65 K/sec
    time            =    60 sec
    send_cost       =   254 ms/GB
    recv_cost       =  1.15 sec/GB
    send_cpus_used  =  6.07 % cpus
    recv_cpus_used  =  27.6 % cpus
tcp_lat:
    latency        =  47.4 us
    msg_rate       =  21.1 K/sec
    time           =    60 sec
    loc_cpus_used  =    11 % cpus
    rem_cpus_used  =    10 % cpus
And finally, you can also choose the size of the message to be used for the
tests. (You can also make it repeat the test with increasing sizes using
the -oo option.) Here is qperf being run with a 4 kB packet size:
root@node2:~# qperf -v -m 4k 10.99.0.1 tcp_bw tcp_lat
tcp_bw:
    bw              =   220 MB/sec
    msg_rate        =    55 K/sec
    msg_size        =     4 KB
    send_cost       =   429 ms/GB
    recv_cost       =  1.16 sec/GB
    send_cpus_used  =   9.5 % cpus
    recv_cpus_used  =  25.5 % cpus
tcp_lat:
    latency        =   145 us
    msg_rate       =  6.91 K/sec
    msg_size       =     4 KB
    loc_cpus_used  =     7 % cpus
    rem_cpus_used  =     5 % cpus
Applying qperf
Here are some examples of where qperf can be useful:
- How does the private networking feature offered by Digital Ocean compare to, say, Linode’s in terms of network throughput and latency?
- Your containers are talking to each other over a Weave overlay network – is this slowing things down?
- How much will adding encryption to a Weave network slow things down?
Interested in the answers to these questions? Let us know in the comments and we’ll try to do a blog post about them in the future.
Going from here
qperf is a handly little tool to have in your toolbox. Another similar
tool is iperf.
While qperf and iperf actively measure your network link, there is another
class of tools that passively monitor network transfer rates, errors and the
like. Our own OpsDash is one of them.