Nginx is a free, open-source, high-performance HTTP server and reverse proxy. Nginx is known for its high performance, stability, rich feature set, simple configuration, and low resource consumption. It powers more than 20% of all websites.
As a key component of your production infrastructure, Nginx needs to be monitored for health and performance. Read on to see how.
Nginx Monitoring With OpsDash
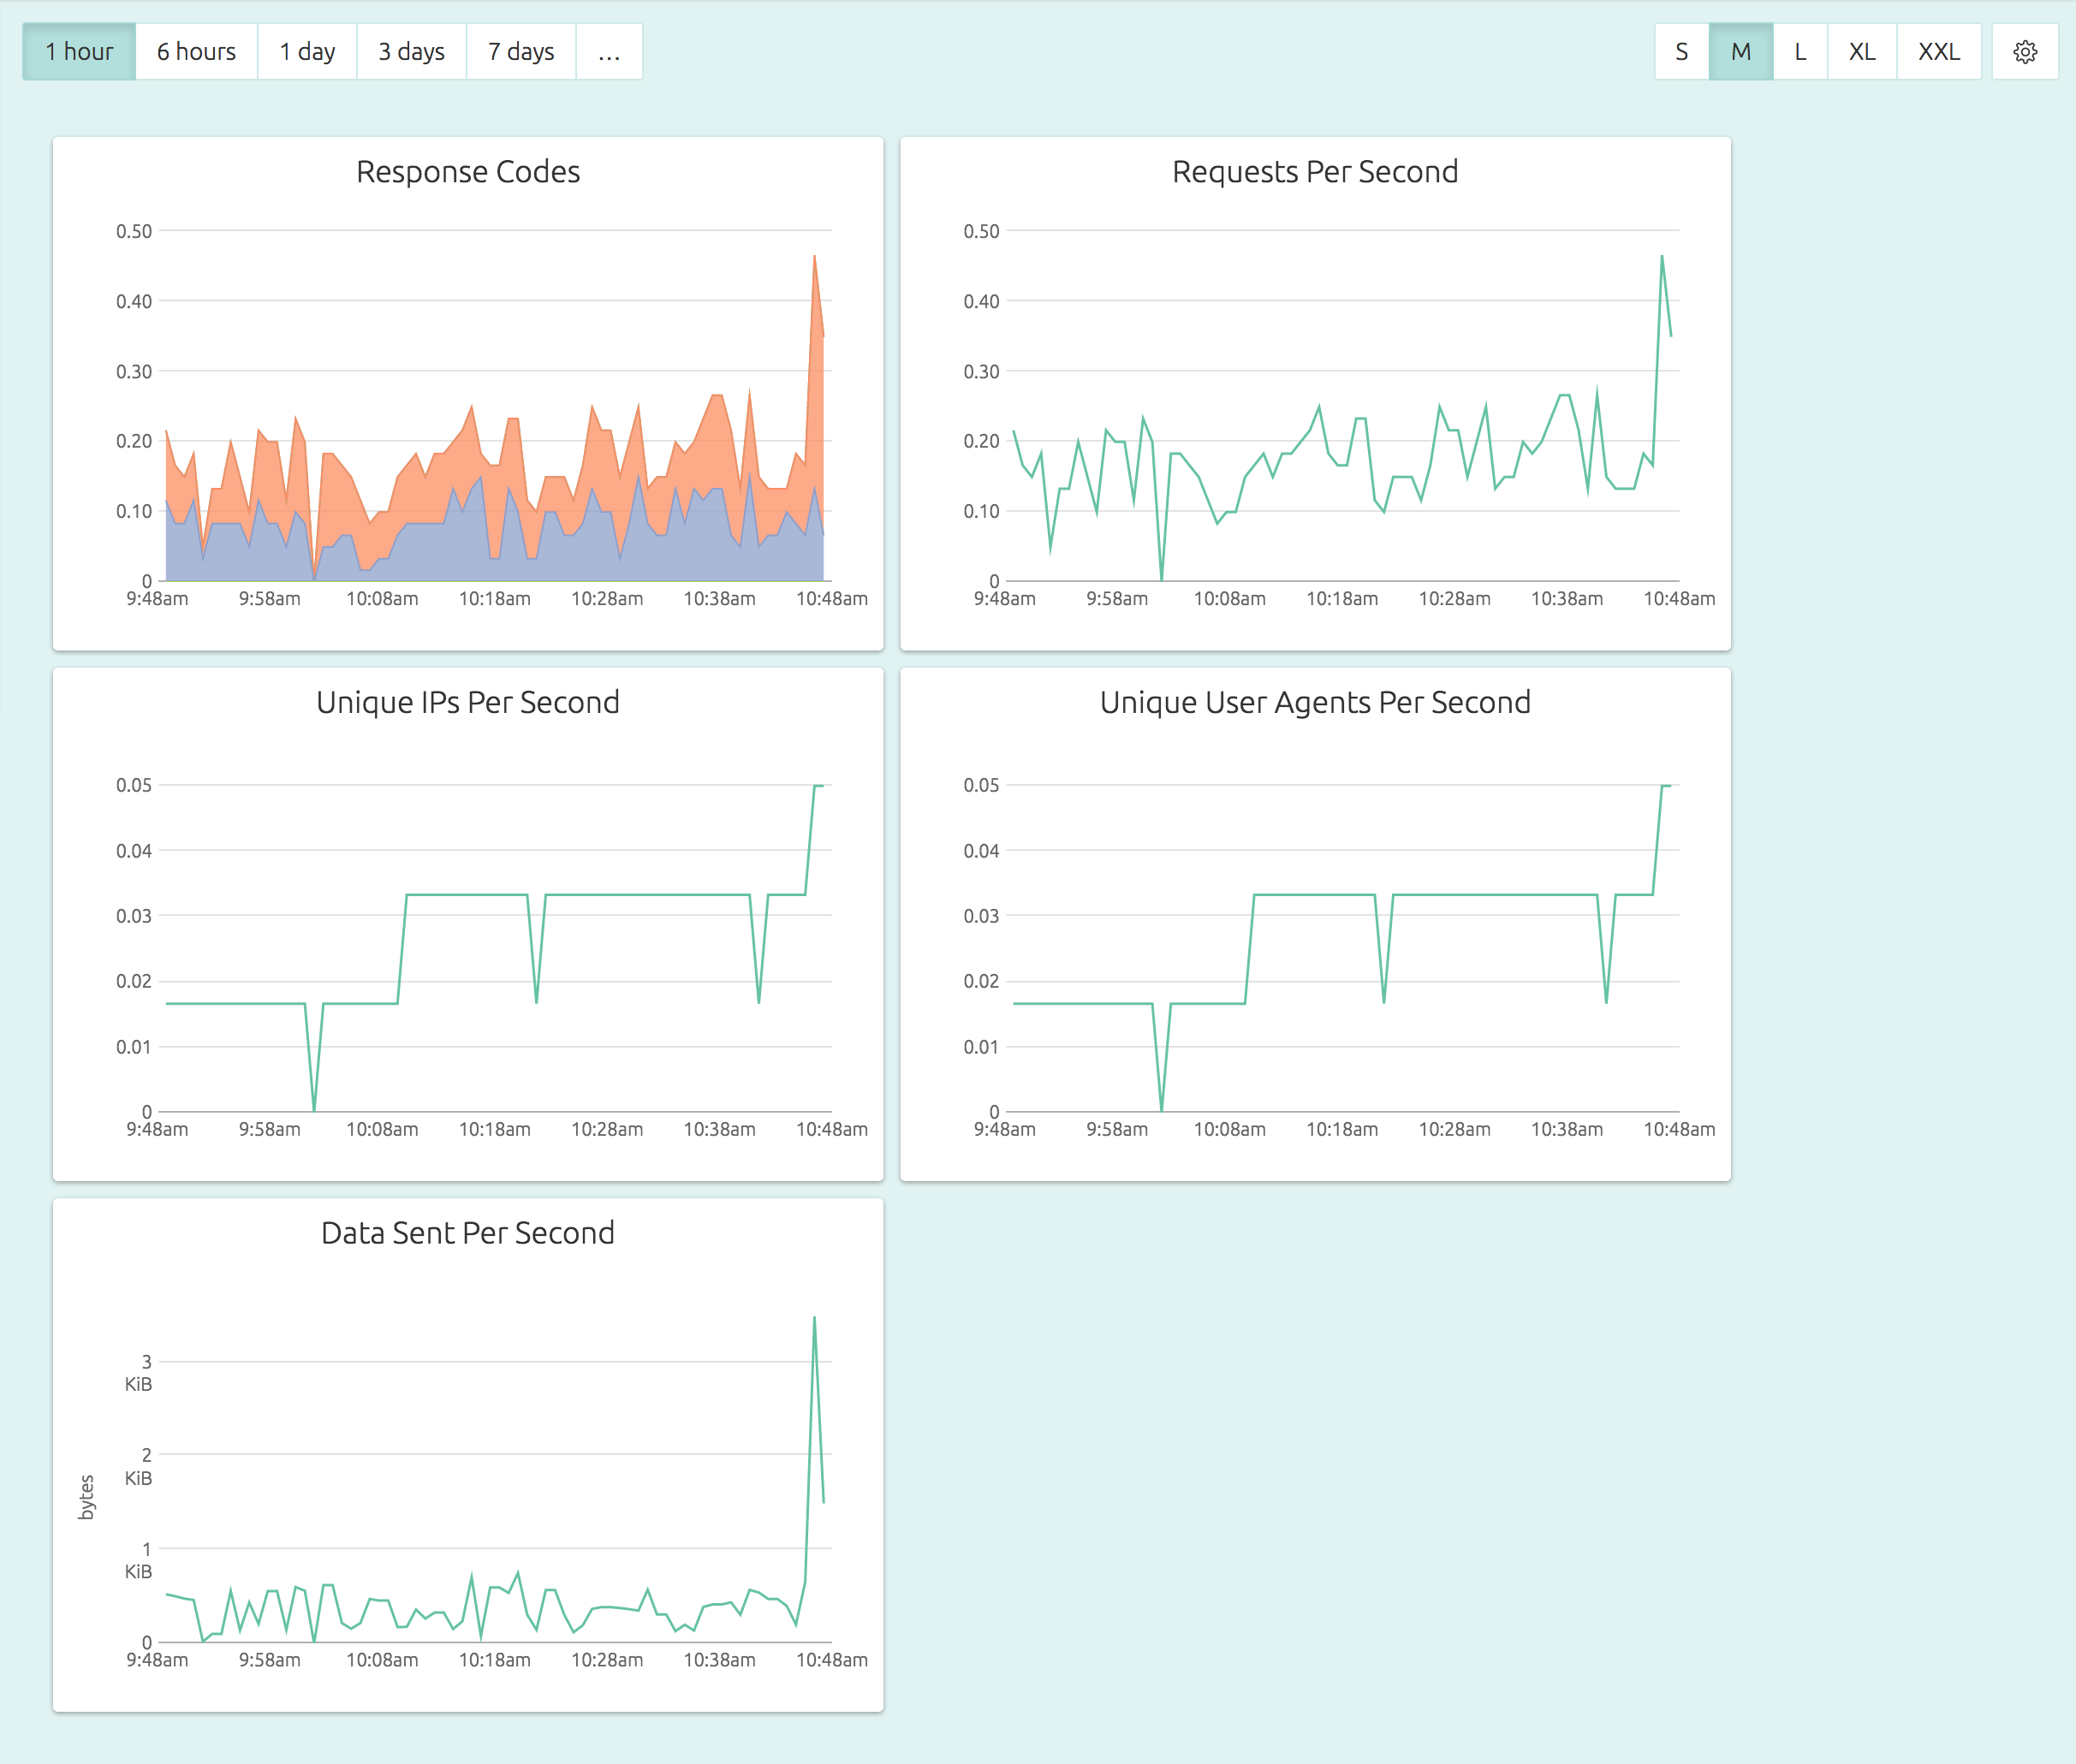
Here’s a default, out-of-the-box Nginx dashboard:
In OpsDash, you can easily set alerts like “if number of number of 5xx responses per second exceed 100, notify me on Slack” in just a few clicks.
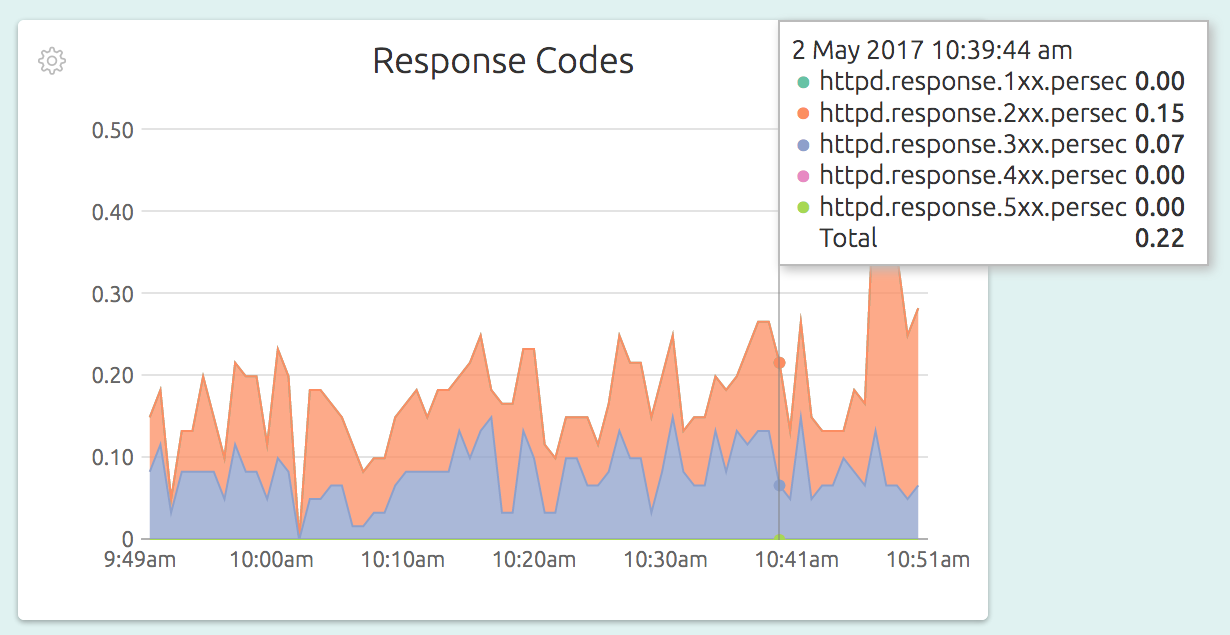
Here is how the Response Codes graphs looks in detail:
All that is needed for this level of monitoring is to have exactly 4 lines in your OpsDash Smart Agent configuration file – like this:
service "nginx-main" {
     type = "nginx"
     logs = "/var/log/nginx/access.log"
}

service "nginx-myvhost" {
     type = "nginx"
     logs = "/var/log/nginx/myvhost-access.log"
}

service "nginx-all-vhosts" {
     type = "nginx"
     logs = "/var/log/nginx/*vhost*-access.log"
}
The configuration has 3 entries (they show up as 3 separate dashboards in the UI), one for the main Nginx server, one for a single virtual host, and another for all the virtual hosts combined.
Read on to see how the OpsDash Smart Agent actually monitors your Nginx servers.
The Access Log
For maximum portability and flexibility, the OpsDash Smart Agent relies on access logs, rather than module-based solutions. Practically, parsing the log files are fast, efficient, unintrusive, and yields nearly as much information as other methods.
The OpsDash Smart Agent reads and parses a given set of access log files each minute, and reports the values to the OpsDash servers. It reads in and parses only as much portion of the access log file as is needed to extract the recent most minute’s worth of metrics, so the parsing process is very light on the server’s resources.
Nginx log files live under /var/log/nginx on most systems. By default, there
is typically an access log file and an error log file. The access log file
is typically of the “combined log format”.
The Combined Log Format
The combined log format is a defacto standard for HTTP access logs, and is used by default by both Nginx and Apache servers. Although Nginx and Apache allows you to customize the format, there is a lot of tooling that work with combined log format logs that it makes sense to leave the default unchanged.
Nginx’s directives for manipulating the log formats, and the description of the combined log format can be found here.
Here is how a single entry in this format looks like:
1.1.1.1 - - [02/May/2017:05:34:14 +0000] "GET /blog/disk-monitoring-linux.html HTTP/1.1" 200 5266 "https://www.google.com/" "Mozilla/5.0 (X11; Linux i686) AppleWebKit/537.36 (KHTML, like Gecko) Ubuntu Chromium/58.0.3029.81 Chrome/58.0.3029.81 Safari/537.36"The fields, in order are:
- The IP address of the incoming connection. If there is a proxy or load balancer in front, this field is usually a comma-separated list of IP addresses.
- The second field is supposed to be “remote logname”, it is usually always just a “-“.
- The username, if HTTP authentication headers were set in the incoming HTTP request. Supplied by the client, so such a user may or may not be valid or authenticated. Value is a “-“ if no username is involved.
- The timestamp when the request was received, enclosed in square brackets.
- The HTTP request line, enclosed in double quotes. The request line has three parts – the method, the URI and the protocol.
- The response code, like 200 or 404.
- The number of bytes that were present in the HTTP response body. If no body was sent, the value is “-“.
- The value of the Referrer field in the incoming HTTP request.
- The value of the User-Agent field in the incoming HTTP request.
The Metrics
From these fields, the OpsDash Smart Agent computes and reports the following metrics:
- Response Codes - The number of 2xx, 3xx, 4xx and 5xx response codes per second.
- Requests Per Second - The number of overall HTTP requests per second.
- Unique IPs Per Second - The number of unique IP addresses that hit the server each second.
- Unique User Agents Per Second - The number of unique user agent strings per second.
- Data Sent Per Second - The size of the HTTP response body data sent each second, in bytes.
With OpsDash, Nginx monitoring is fast and easy. You can be up and running in just a few minutes. No need to waste time getting set up, but don’t neglect monitoring this key component of your production infrastructure either. Get started today!
New Here?
OpsDash is a server monitoring, service monitoring, and database monitoring solution for monitoring MySQL, PostgreSQL, MongoDB, memcache, Redis, Apache, Nginx, Elasticsearch and more. It provides intelligent, customizable dashboards and spam-free alerting via email, HipChat, Slack, PagerDuty and Webhooks. Send in your custom metrics with StatsD and Graphite interfaces built into each agent.