Like seeing your server monitoring metrics on your business dashboard? Do you have a Dashing dashboard on your wall TV that you’d like to add OpsDash status to? Read on!
Dashing is a popular open-source dashboard from Shopify, and we don’t dispute it’s claims to being “exceptionally handsome!” OpsDash now provides APIs with which you can not only send in custom metrics, but also query out alert status. Let’s try pulling the alert status out of OpsDash and show it in a Dashing dashboard, ending up like this:
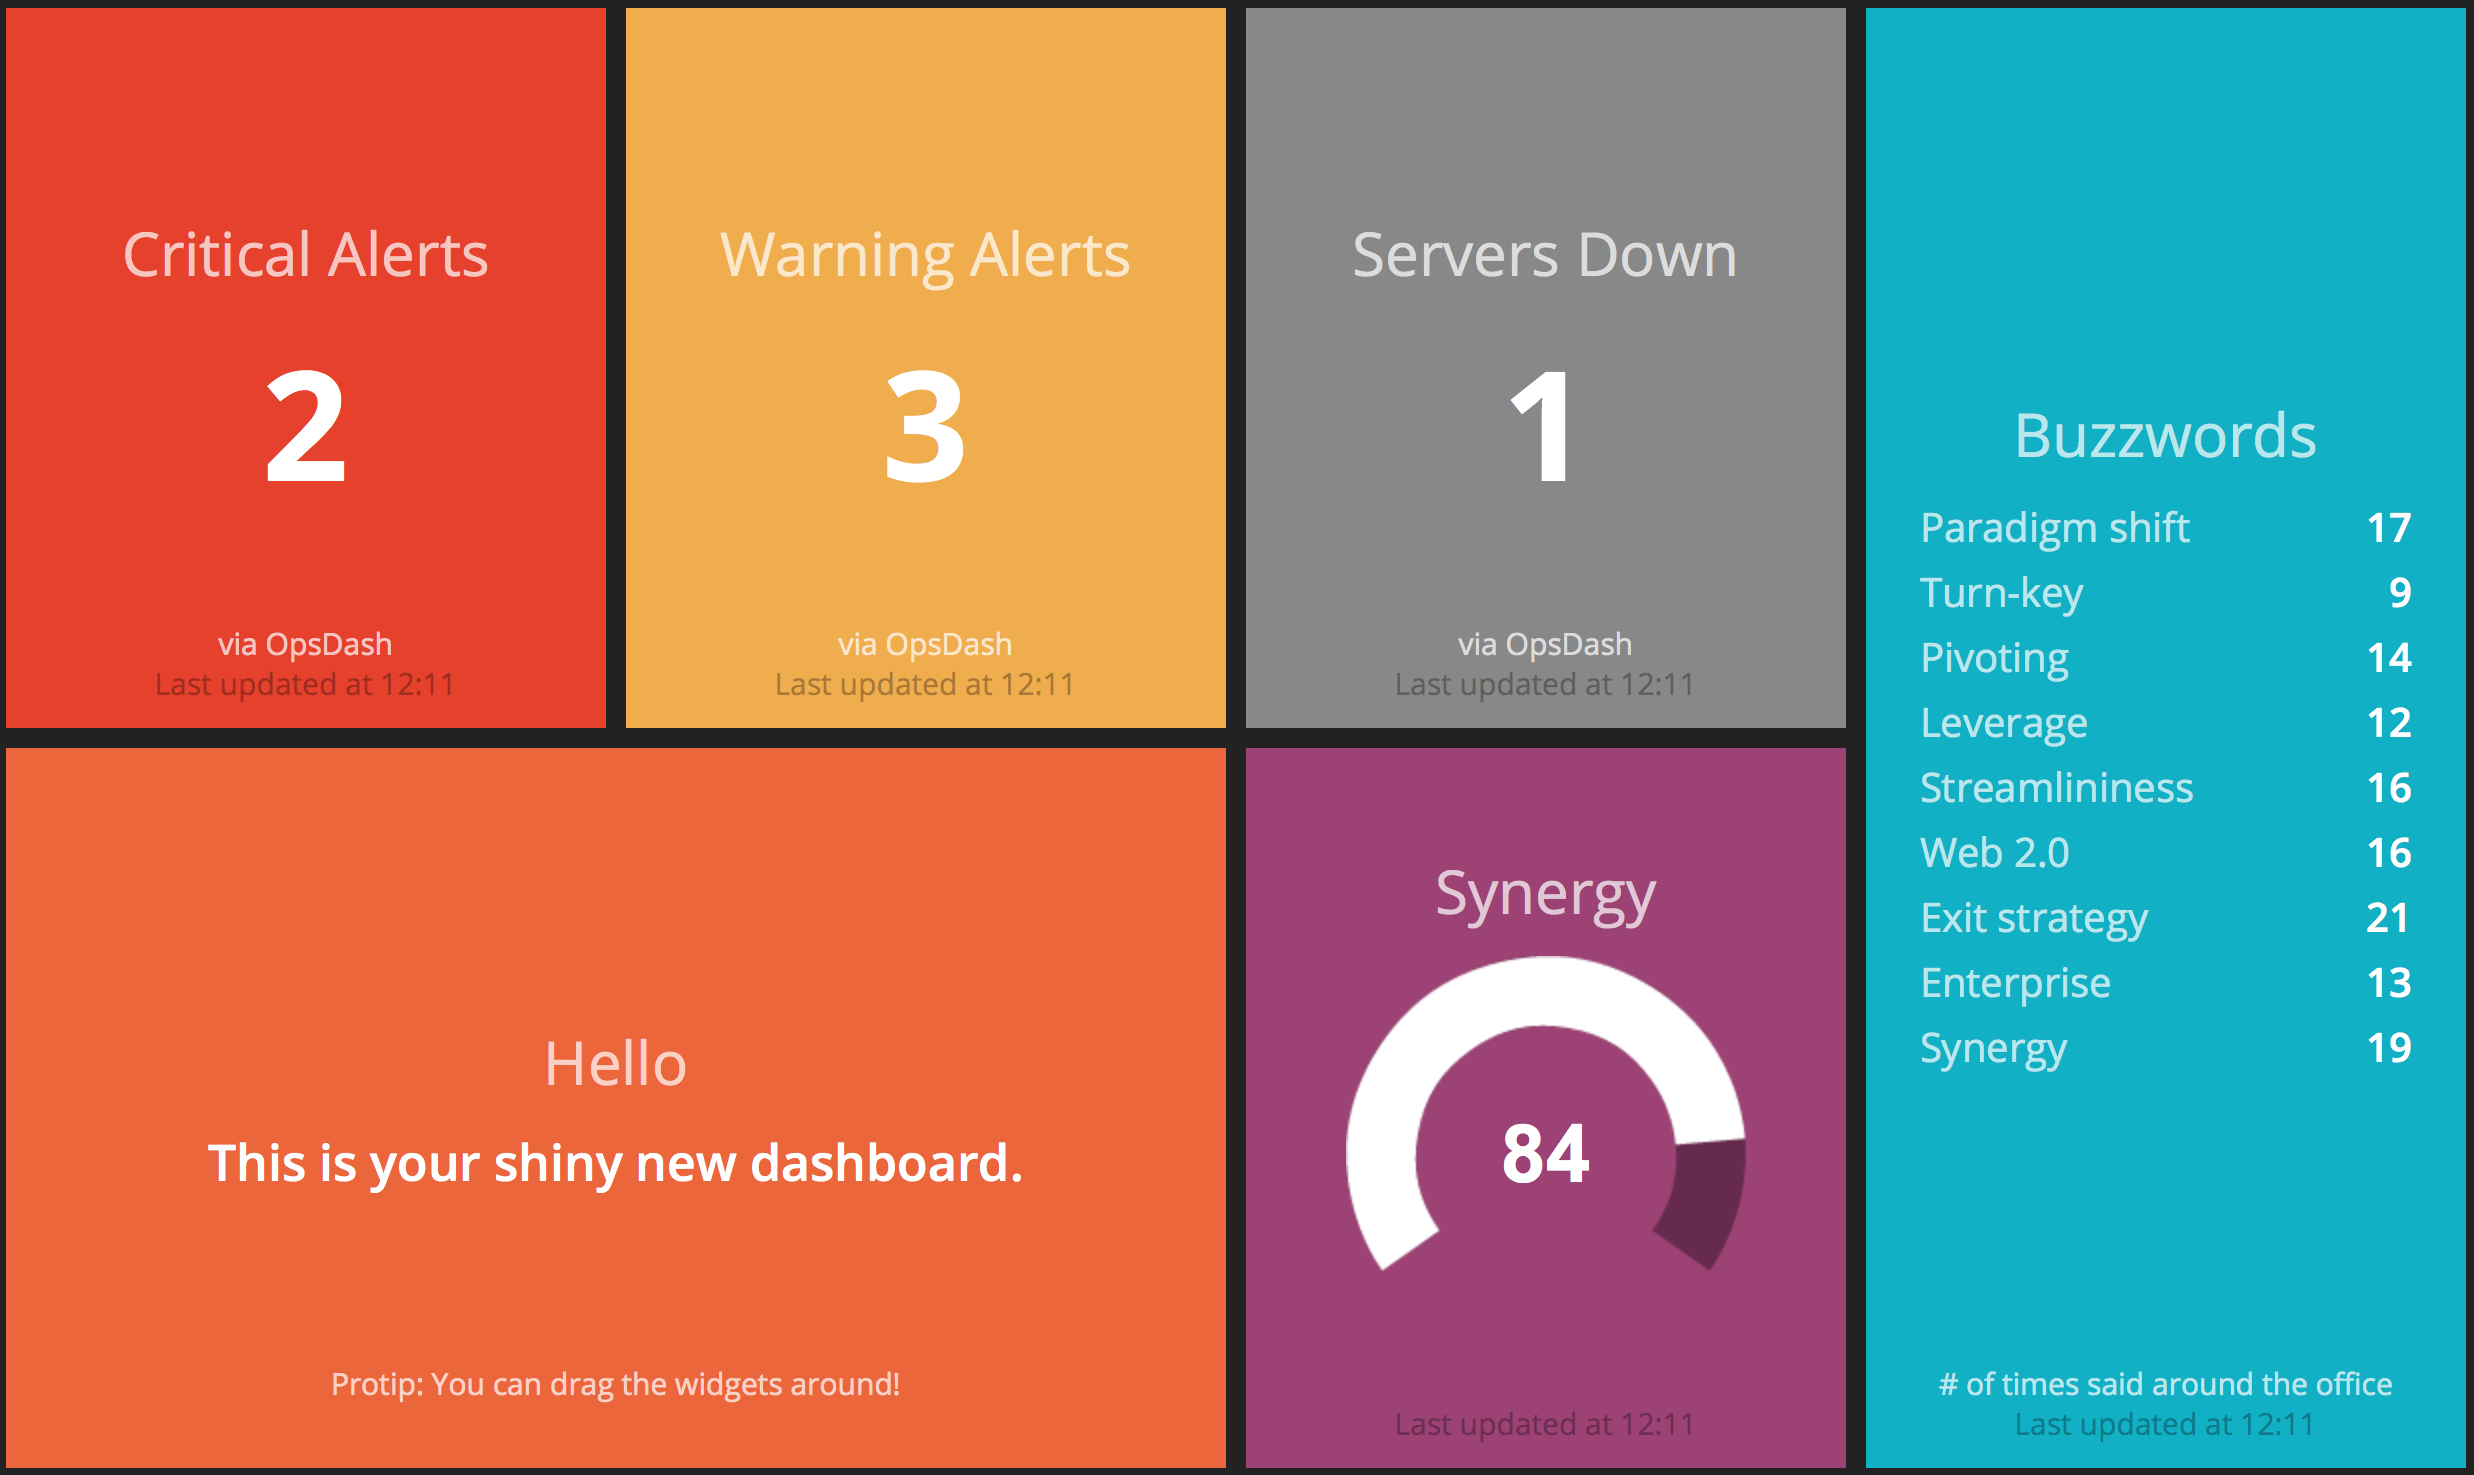
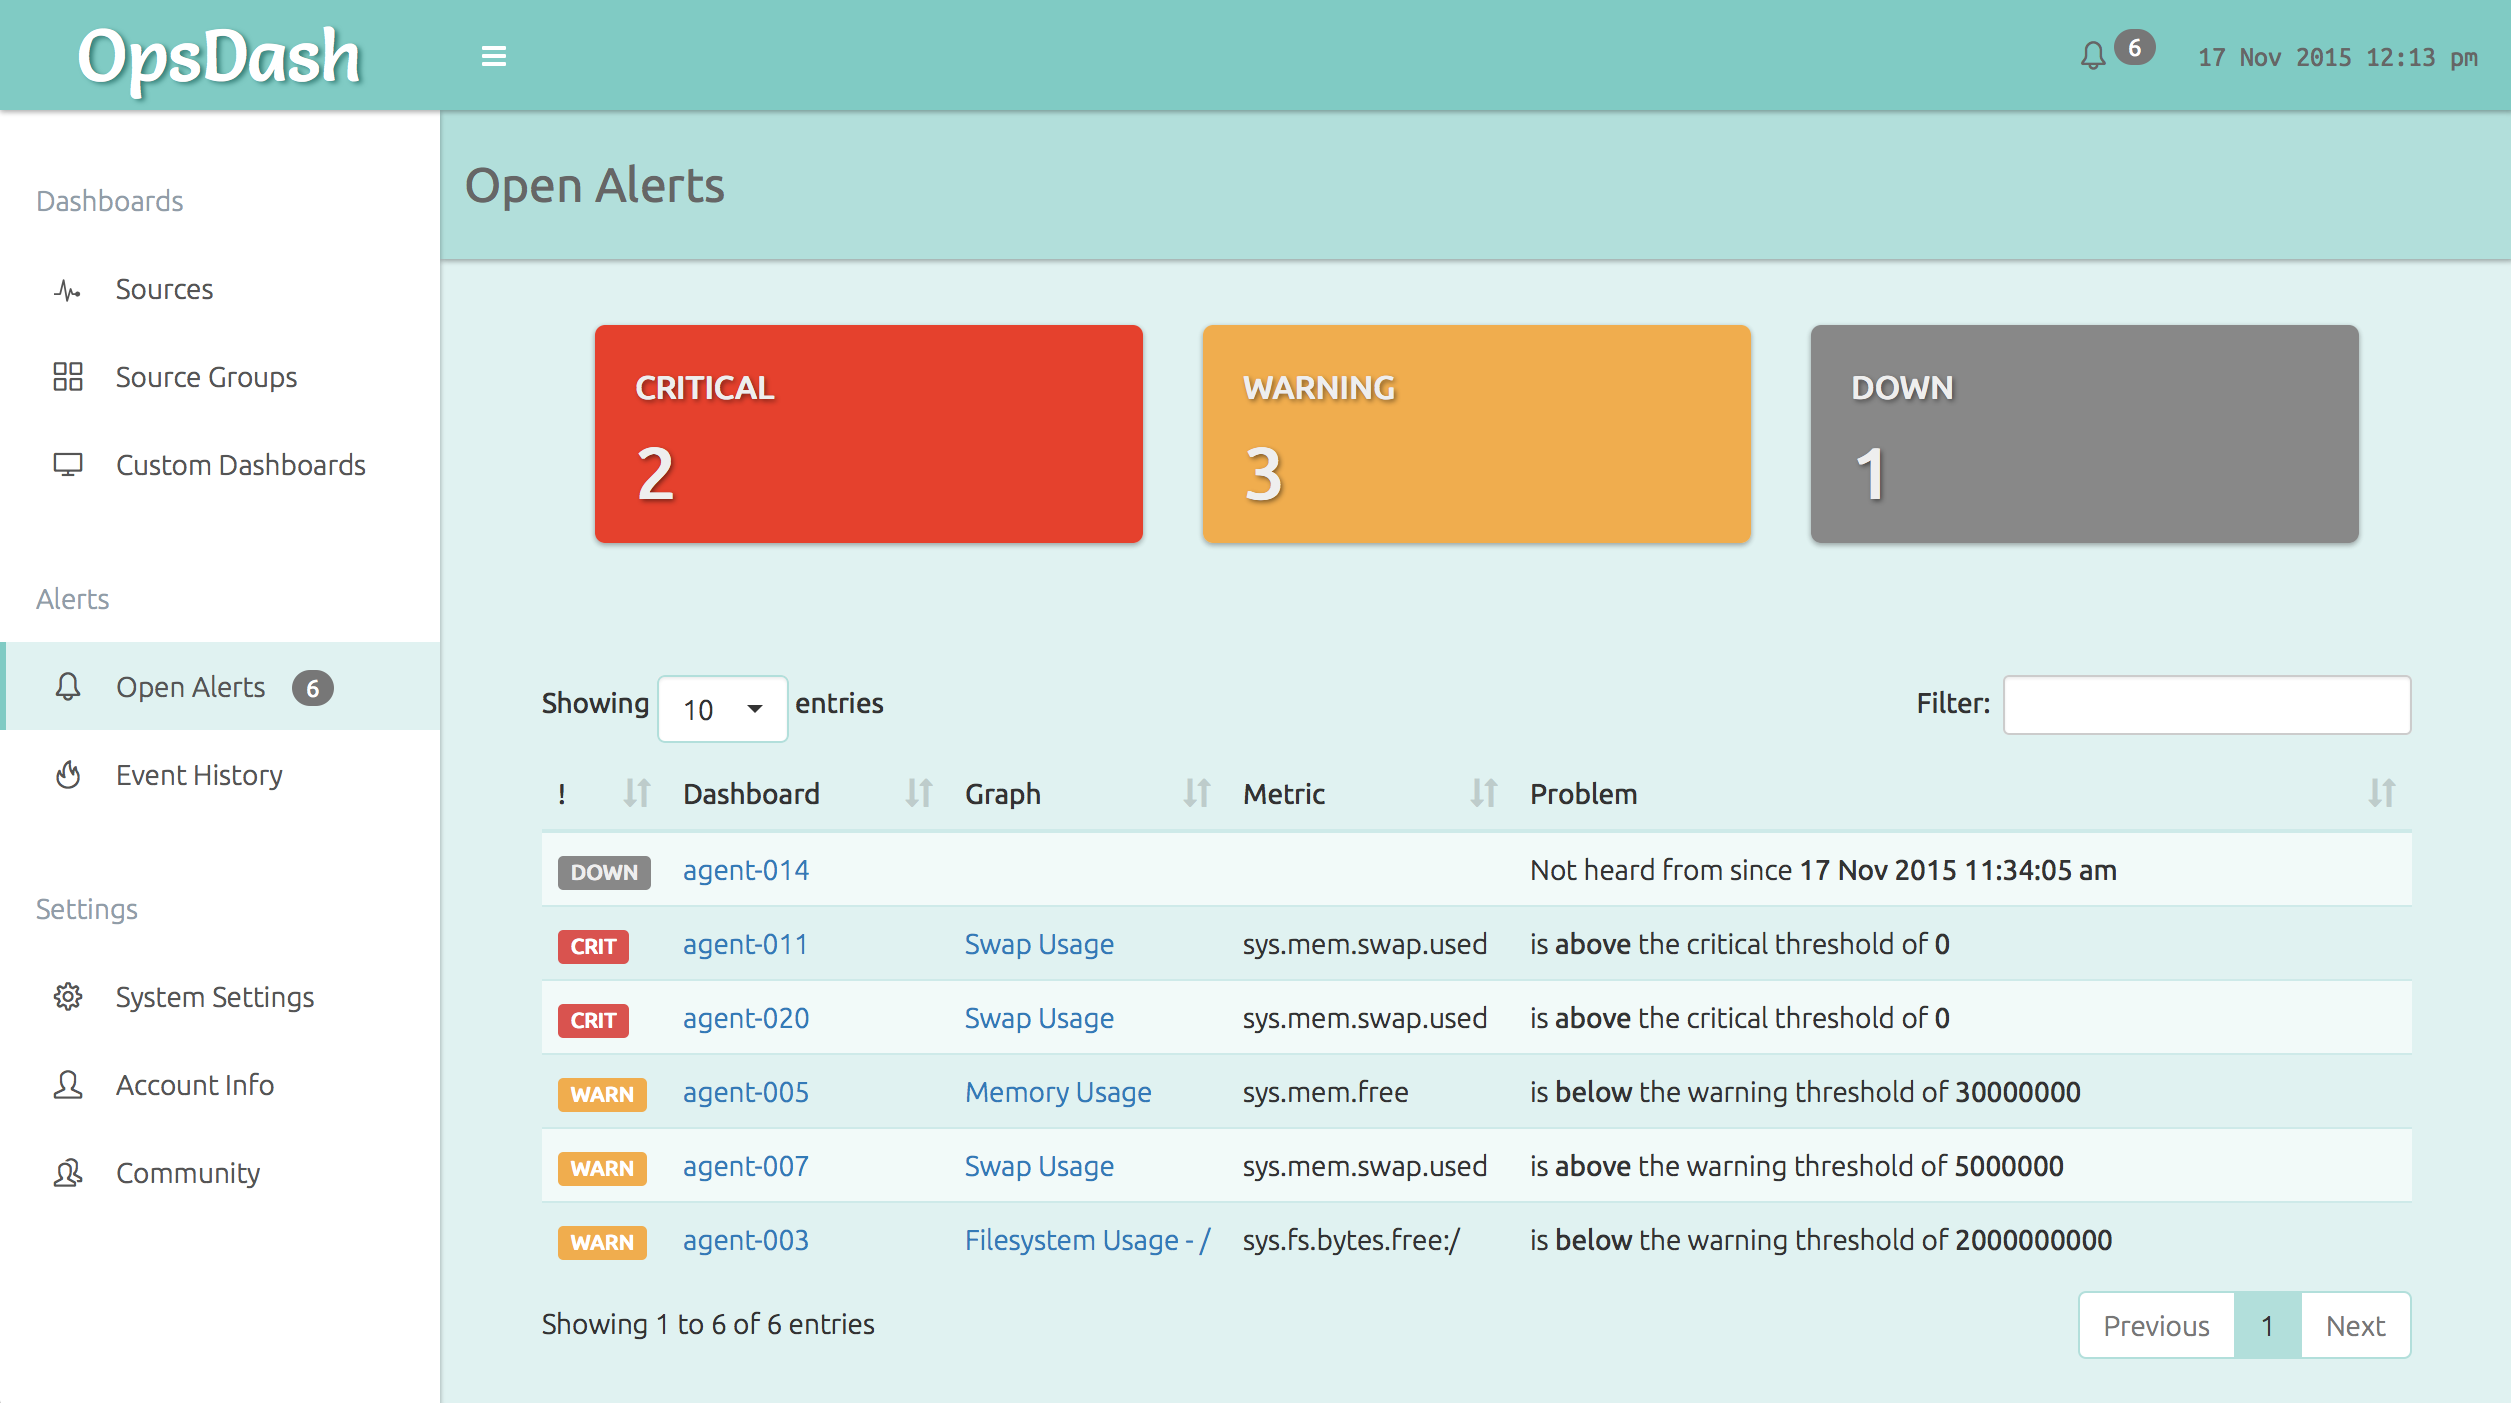
This is a tweak of the Dashing sample dashboard, with the first three widgets showing OpsDash alerting status. The OpsDash open alerts page, at the time, looked like this:
Let’s see how to set this up!
The OpsDash API
The OpsDash APIs can be enabled by setting api.enable = 1 in your OpsDash
server’s /etc/opsdash/server.cfg. Once enabled, you can access the APIs
at http://your.server:port/pubapi/v1/.... The APIs allow you to send custom
metrics, create, list, delete sources, services and source groups and also of
course, to query the OpsDash status.
Fetching the status couldn’t be simpler:
$ curl http://10.0.0.128:8080/pubapi/v1/status
{
  "down": [
    {
      "source": "agent-014",
      "last": 1447740245
    }
  ],
  "breach": [
    {
      "dashid": 1,
      "dashname": "agent-011",
      "graphid": 13,
      "graphtitle": "Swap Usage",
      "metric": "sys.mem.swap.used",
      "value": 6.447104e+06,
      "threshold": 0,
      "breachtype": 4
    },
...snip...
You can find the full OpsDash API documentation here, including the details of the /status endpoint.
The Dashing Job
Given this API, we can write a Dashing job (a small Ruby script), that pulls this info and parses out the required values:
# save as jobs/opsdash.rb
require 'open-uri'
require 'json'

SCHEDULER.every '30s' do
  # fetch data from OpsDash
  content = open("http://10.0.0.128:8080/pubapi/v1/status").read
  data = JSON.parse(content)

  # parse the data
  downs = data["down"].length
  crits = data["breach"].count{|x| [1,4].include? x["breachtype"]}
  warns = data["breach"].count{|x| [2,3].include? x["breachtype"]}

  # send it to Dashing
  send_event('opsdash_down', { current: downs })
  send_event('opsdash_crit', { current: crits })
  send_event('opsdash_warn', { current: warns })
end
This sends three values to Dashing, which can be included in dashboard
configuration files that live under the dashboards folder. Note that
in the above code, 10.0.0.128 is the OpsDash server’s IP which you’ll
need to change.
Here is the HTML snippet that we put in dashboards/sample.erb to show
the Critical Alerts widget in the screenshot:
<li data-row="1" data-col="1" data-sizex="1" data-sizey="1">
  <div data-id="opsdash_crit" data-view="Number"
    data-title="Critical Alerts" data-moreinfo="via OpsDash"
    style="background-color:#E5412D"></div>
</li>
Try it out yourself! Tweet your screenshots to @therapidloop and we’ll retweet them!