OpsDash is a next generation solution for monitoring servers, services, and databases. OpsDash is fast to setup and easy to use. It’s been built from the ground up for maximum performance.
Over the past several months, we’ve gotten tons of requests to provide OpsDash as a SaaS solution. The team has been working hard and we are excited to announce that the OpsDash SaaS Beta is now available. Signup today! It’s absolutely free during beta.
So, why should you invest your time checking out OpsDash? What makes it different from the other monitoring solutions out there?
Smart Agent – zero-dependency single-binary, with built-in statsd and graphite
You can install the agent and be up and running with OpsDash server monitoring in a matter of minutes. The all-new OpsDash Smart Agent is a single-binary, dependency-free Go binary that is very light on resources. Agents are available for 32-bit Intel, 64-bit Intel and armv7 platforms. The OpsDash smart agent discovers disks and network interfaces by itself. It can collect data from various services, like MySQL, PostgreSQL, Elasticsearch, MongoDB and more by just editing a simple, intuitive configuration file. It also comes with bulit-in statsd and graphite daemons that aggregate and forward the data to OpsDash.
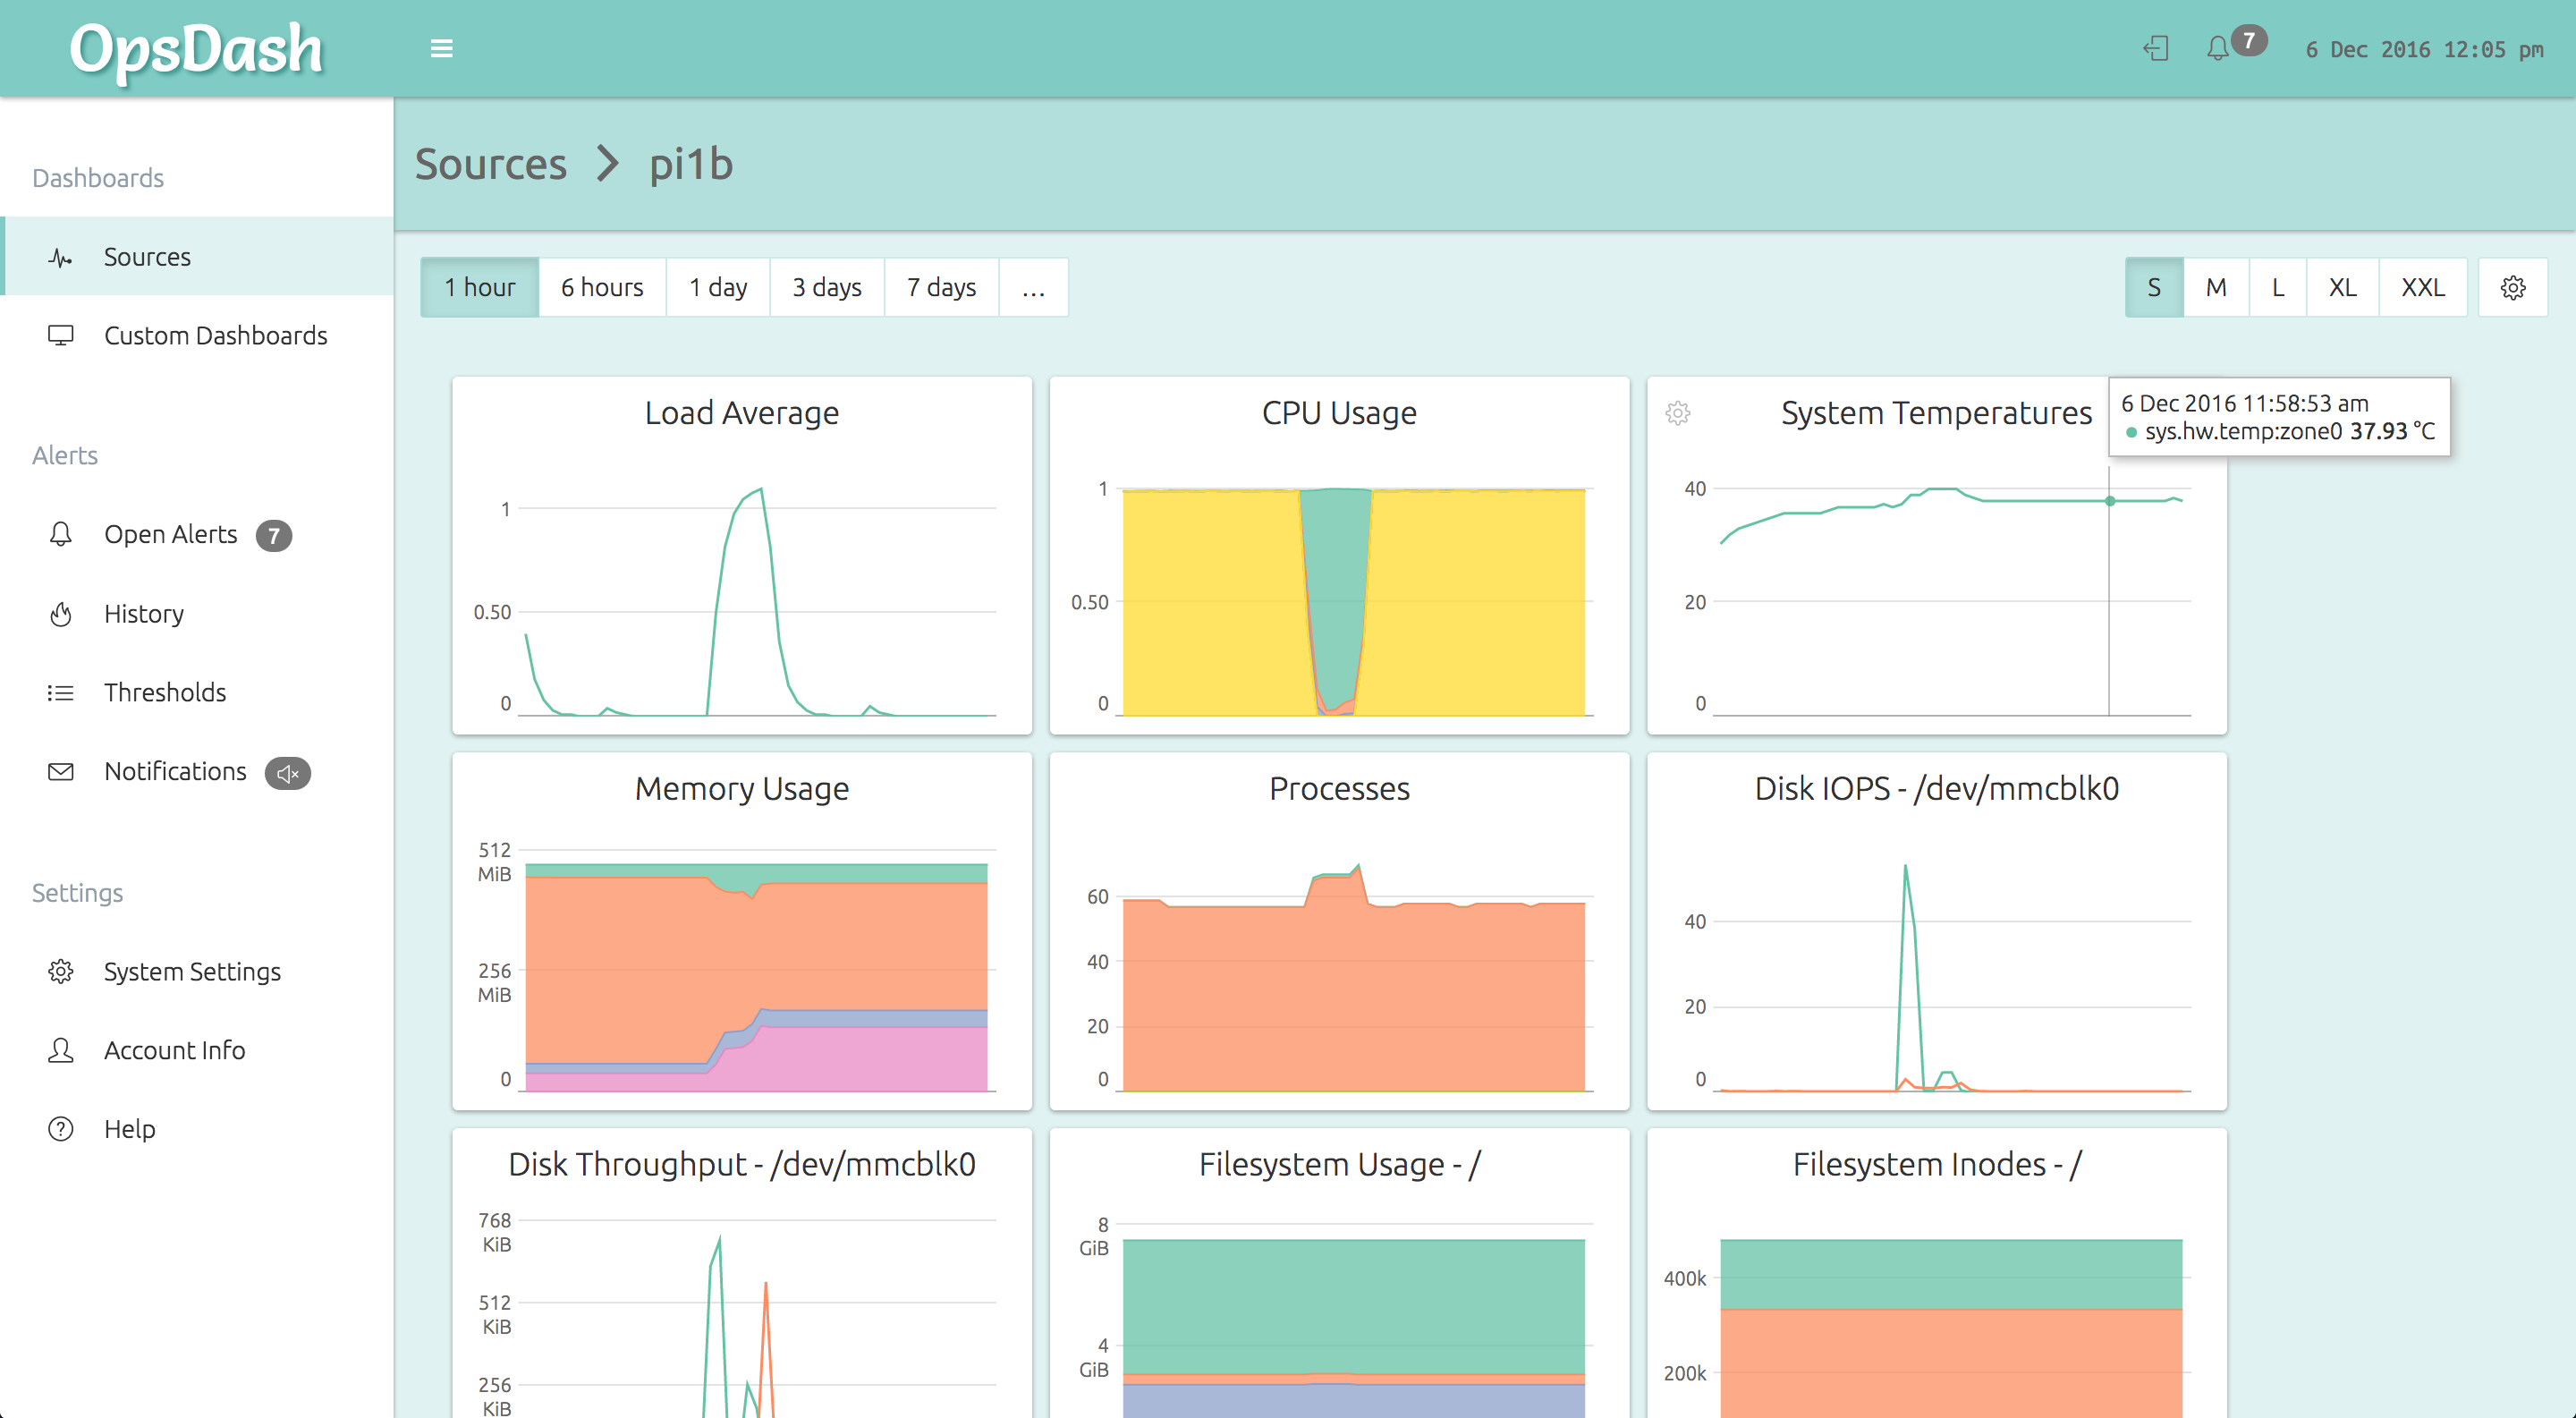
Curated Dashboards – with pre-selected metrics to save you time
For each server you monitor, OpsDash automatically sets up server monitoring dashboards that bring out the most important health and performance metrics. No configuration, no templates. You can of course, customize the dashboards, or design your own, if you like. Check out our curated dashboards for services and databases too. No need to worry about the standard stuff, you can move on to customizing what’s unique to your setup.
Spam-free Alerting & Notification – via Slack, HipChat, PagerDuty and Email
With OpsDash, you can filter out the noise, and make sure the important stuff gets to the right people. You can tell OpsDash how often alerts should be sent and when they should not be sent. You can easily set alerts for upper and lower limits for any metric. Both critical and warning limits can be set. Just click on the graph in your OpsDash dashboard, and enter the appropriate values under alert settings. The new Thresholds page gives instant overview of all alert thresholds set across graphs and dashboards. Notifications can easily be setup to be sent out via Email, Slack, HipChat, PagerDuty.
Next Generation Technology – built from the ground up for maximum performance
OpsDash has been built from the ground up for performance, efficiency and reliability. The entire OpsDash backend stack and application code uses only on components built with C, C++ and Go, allowing us to provide you with a highly performant, reliable solution to meet your monitoring needs.
Check it out and let us know what you think! Beta participation is absolutely free. You can find out more about post-beta pricing plans here. Of course, if self-hosted is a better fit for you, no worries, nothing has changed there!
You can signup for OpsDash SaaS here.
Happy Monitoring!