We’re happy to announce the release of OpsDash v1.11 (self-hosted). This release includes: Webhooks, Info Sheets, and support for HAProxy monitoring.
Webhooks
OpsDash comes with powerful but easy-to-use alert notification routing and suppression features. You can define routing parameters for specific notification types to ensure your team isn’t overloaded. OpsDash makes it easy to post notifications to Slack, HipChat, Mattermost or send them via Email. You can also easily integrate with leading incident management solutions, including OpsGenie, PagerDuty and VictorOps or use Webhooks for custom processing.
Webhooks can be set up to receive alert notifications. You can configure them in the OpsDash UI. For more on integrating Webhooks, see the Webhook section in the OpsDash API Docs.
Info Sheets
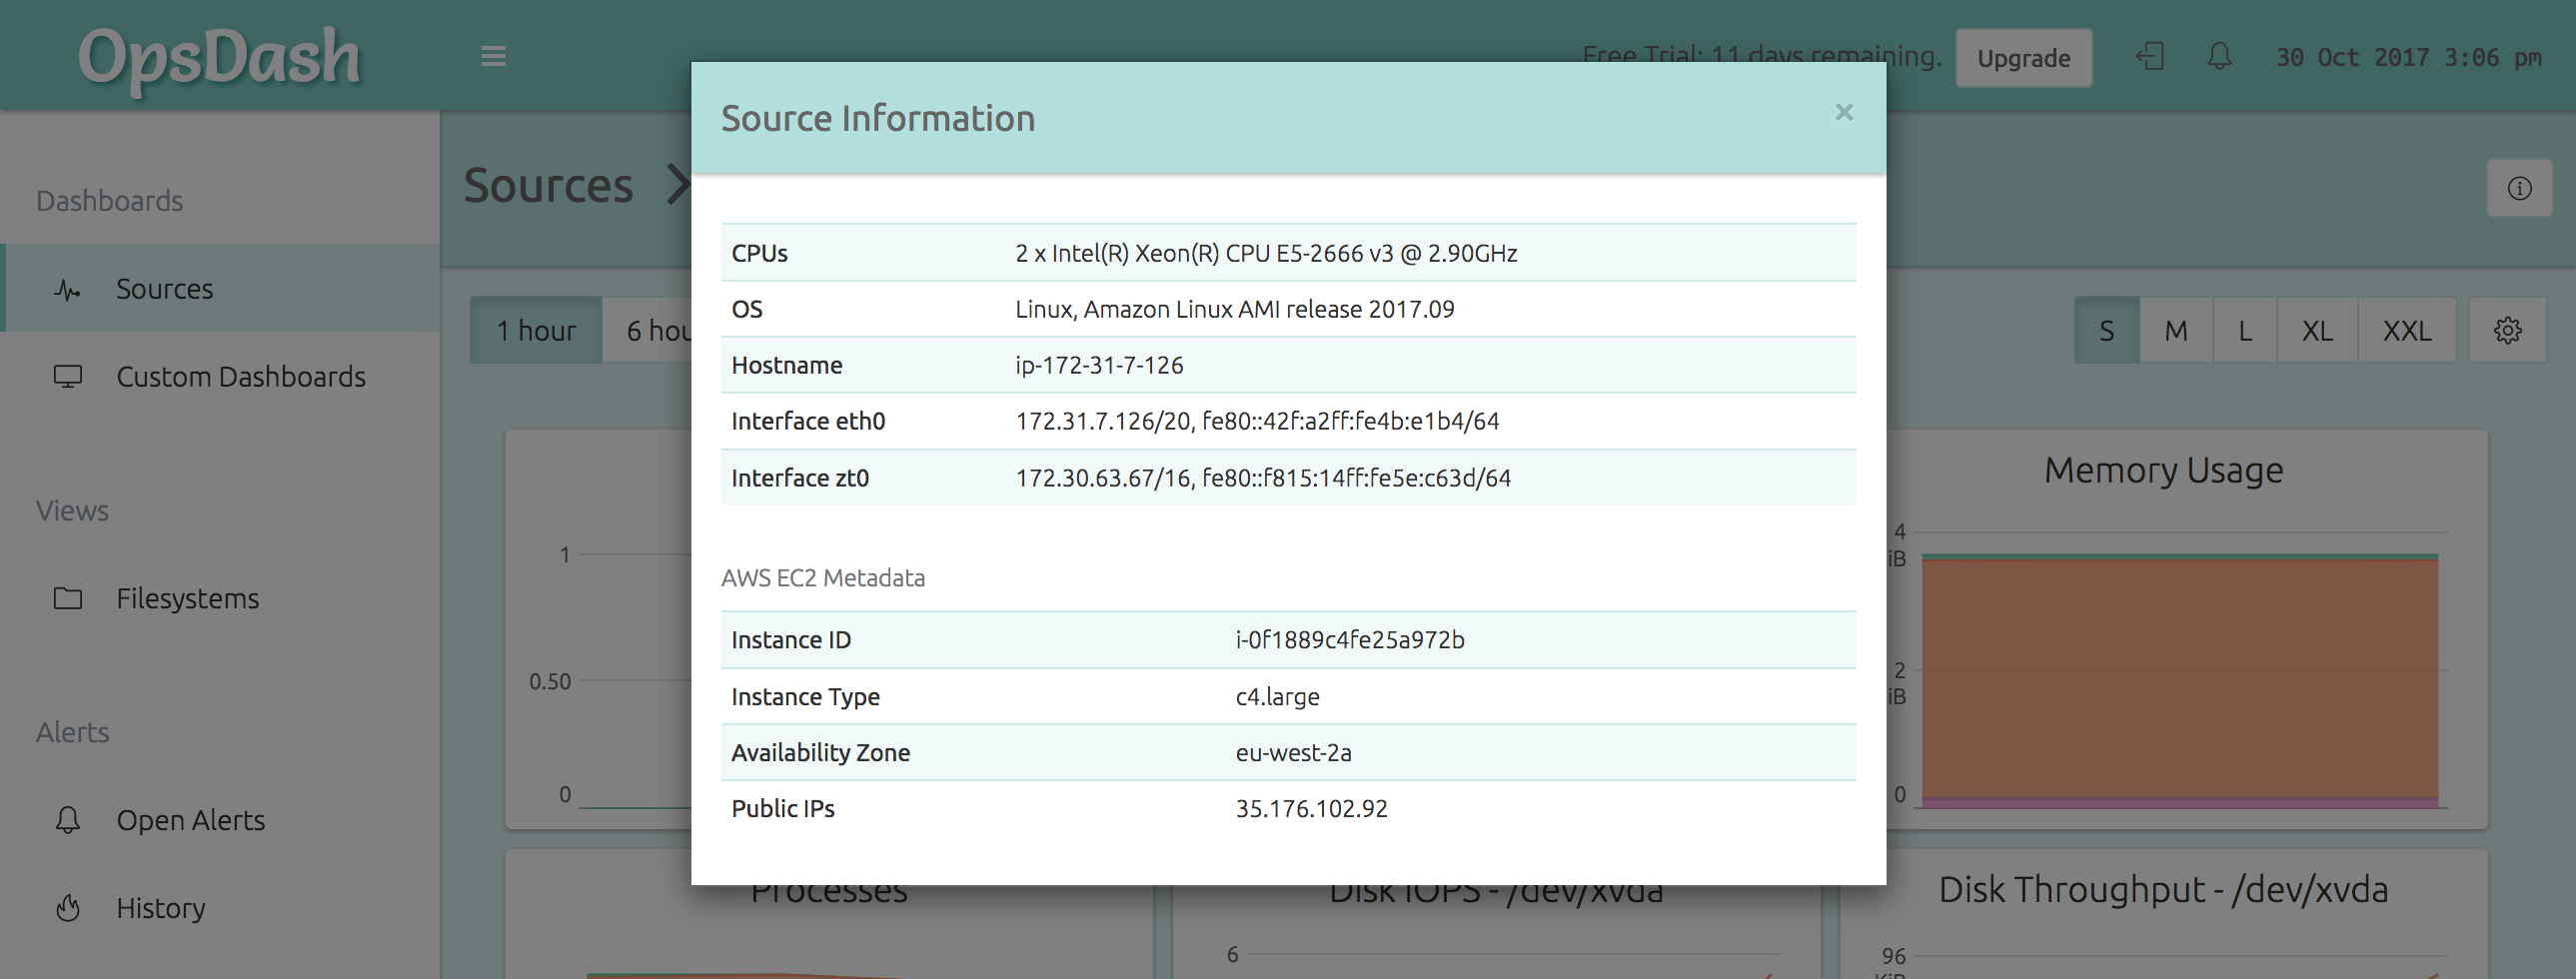
The OpsDash agent can now collect and report important sever attributes - click on the “(i)” icon for a quick, convenient overview.
The Info Sheets for servers contain details of CPU model, the name and version of the Linux distro that it is running and network interface names and IPs. For servers running on Amazon, Google or DigitalOcean clouds, more information like the availability zone, public IP addresses, etc. are also available.
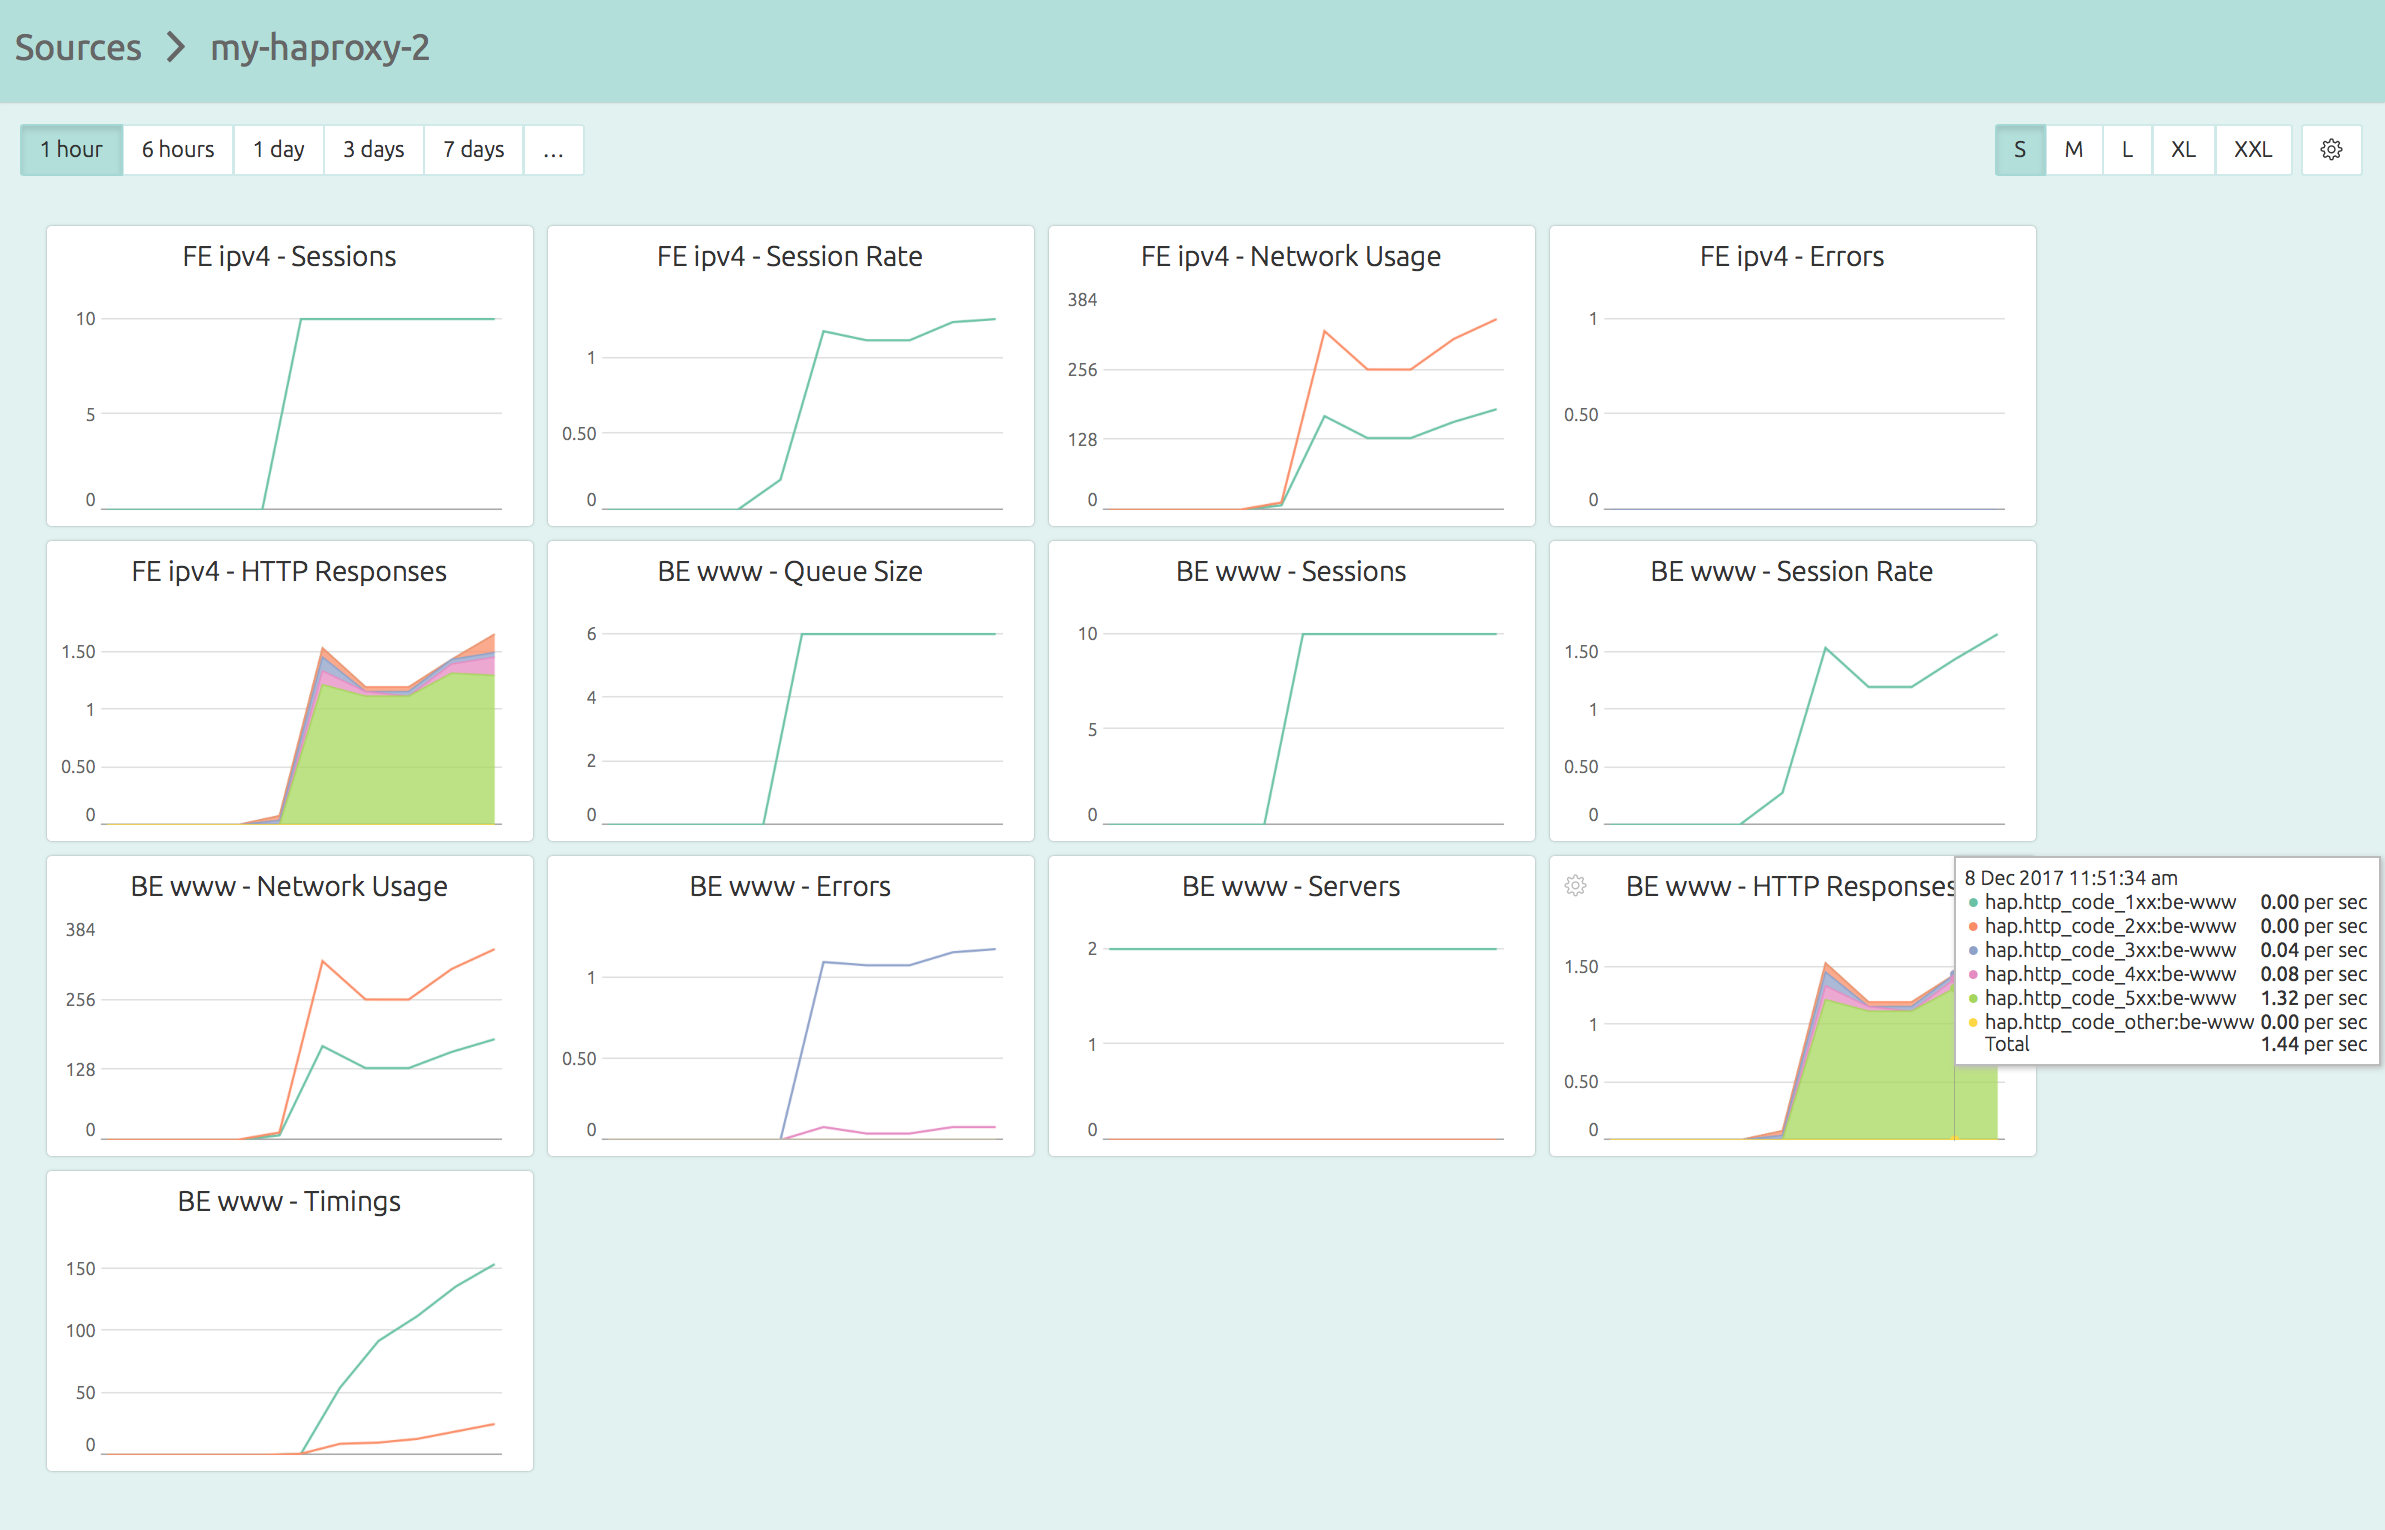
HAProxy Monitoring
With OpsDash, you can quickly start monitoring HAProxy, and get instant insight into key metrics. OpsDash dashboards come pre-configured, setup to monitor the most important HAProxy metrics. No messing around with individual metrics, figuring out which of them are important, no editing graph templates.
OpsDash can query your HAProxy stats via stats HTTP URLs or via stats sockets. It also accepts username and password for basic authentication of the HTTP stats URL.
Here’s how OpsDash’s curated dashboards come out of the box:
Ready To Upgrade?
Follow the steps listed here. For this version, we also recommend upgrading the agents to v1.11, which is required for Info Sheets.
New Here?
OpsDash is a server monitoring, service monitoring, and database monitoring solution for monitoring Docker, MySQL, PostgreSQL, MongoDB, memcache, Redis, Apache, Nginx, Elasticsearch and more. It provides intelligent, customizable dashboards and rule-based alerting via email, HipChat, Slack, PagerDuty, OpsGenie, VictorOps and Webhooks. Send in your custom metrics with StatsD and Graphite interfaces built into each agent. OpsDash is available in both SaaS and Self-Hosted Versions.