OpsDash can get you started with monitoring your Redis and Memcache instances and clusters in no time! OpsDash dashboards are designed to bring up and present key health and performance metrics with zero configuration and fiddling around.
Redis
Add your Redis instance as a new service to be monitored in OpsDash:
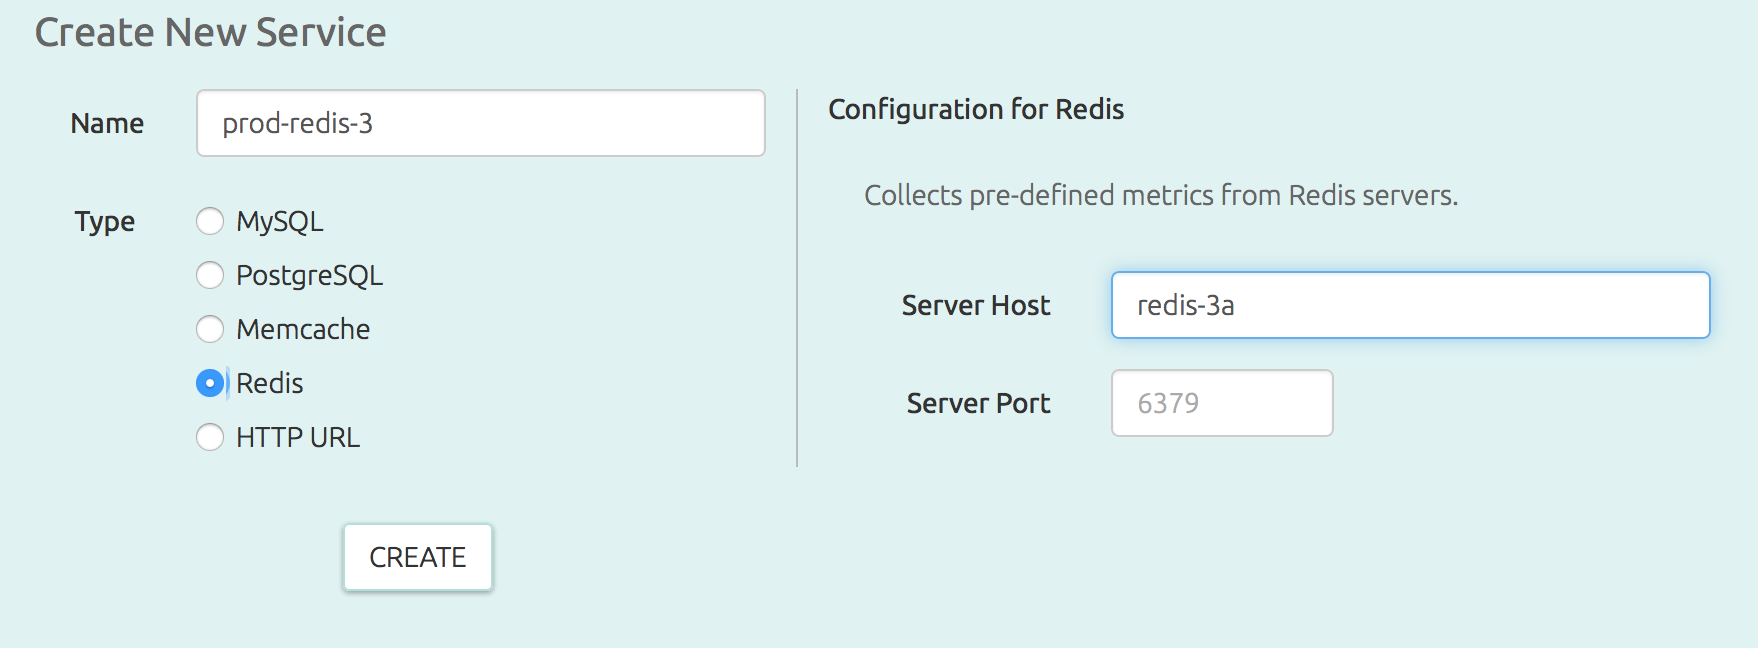
Hit “Create” and you’re done!
Within minutes, and without any further configuration, you will be able to see a dashboard like this:
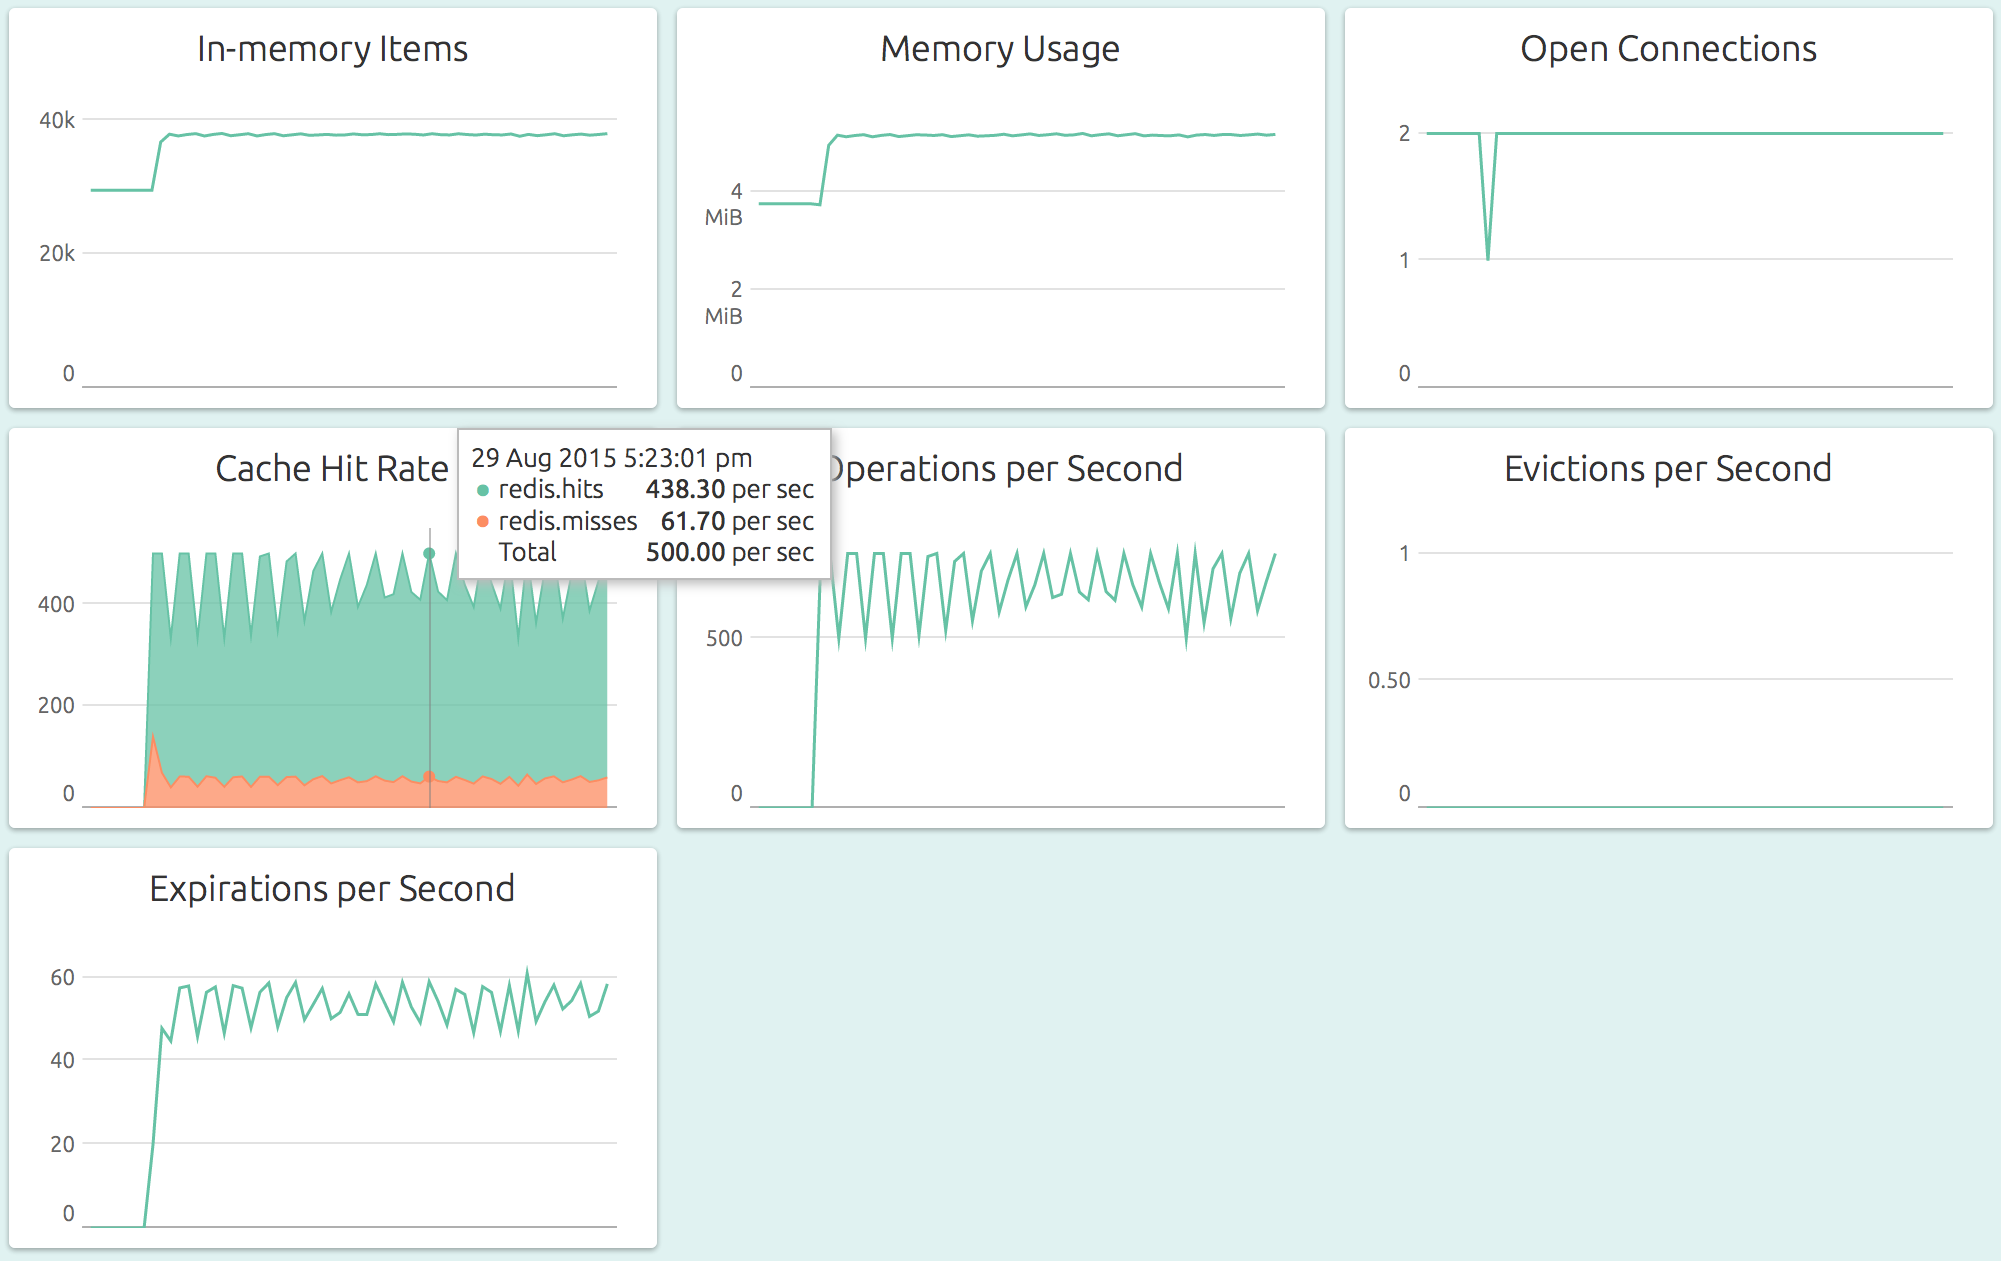
This dashboard shows key metrics relevant to the Redis instance’s health and performance:
- Memory Usage: The total size of all data held in-memory is perhaps the most critical metric to be monitored. Data getting pushed out of memory as evictions, and data getting removed as expirations are also important related metrics. The number of items stored is also interesting, especially if the size of individual values keep growing over time.
- Throughput: The number of operations that the instance is performing each second. You may find that this number varies naturally with external factors like website traffic peak hours and concurrent sessions.
- Cache Efficiency: The ratio of cache hits to misses is very relevant if you are using your Redis instance as a LRU cache or a web session token cache, where many of the stored keys have expiration times.
- Connections: Unexpected spikes in open connections are usually an indication of trouble. It should typically be stable and independent of external factors like traffic or load, any deviation is an indication of bad code or unauthorized access.
Memcache
Memcache instances can also be configured as services to be monitored, similar to Redis. The default dashboard for a Memcache instance looks like this:
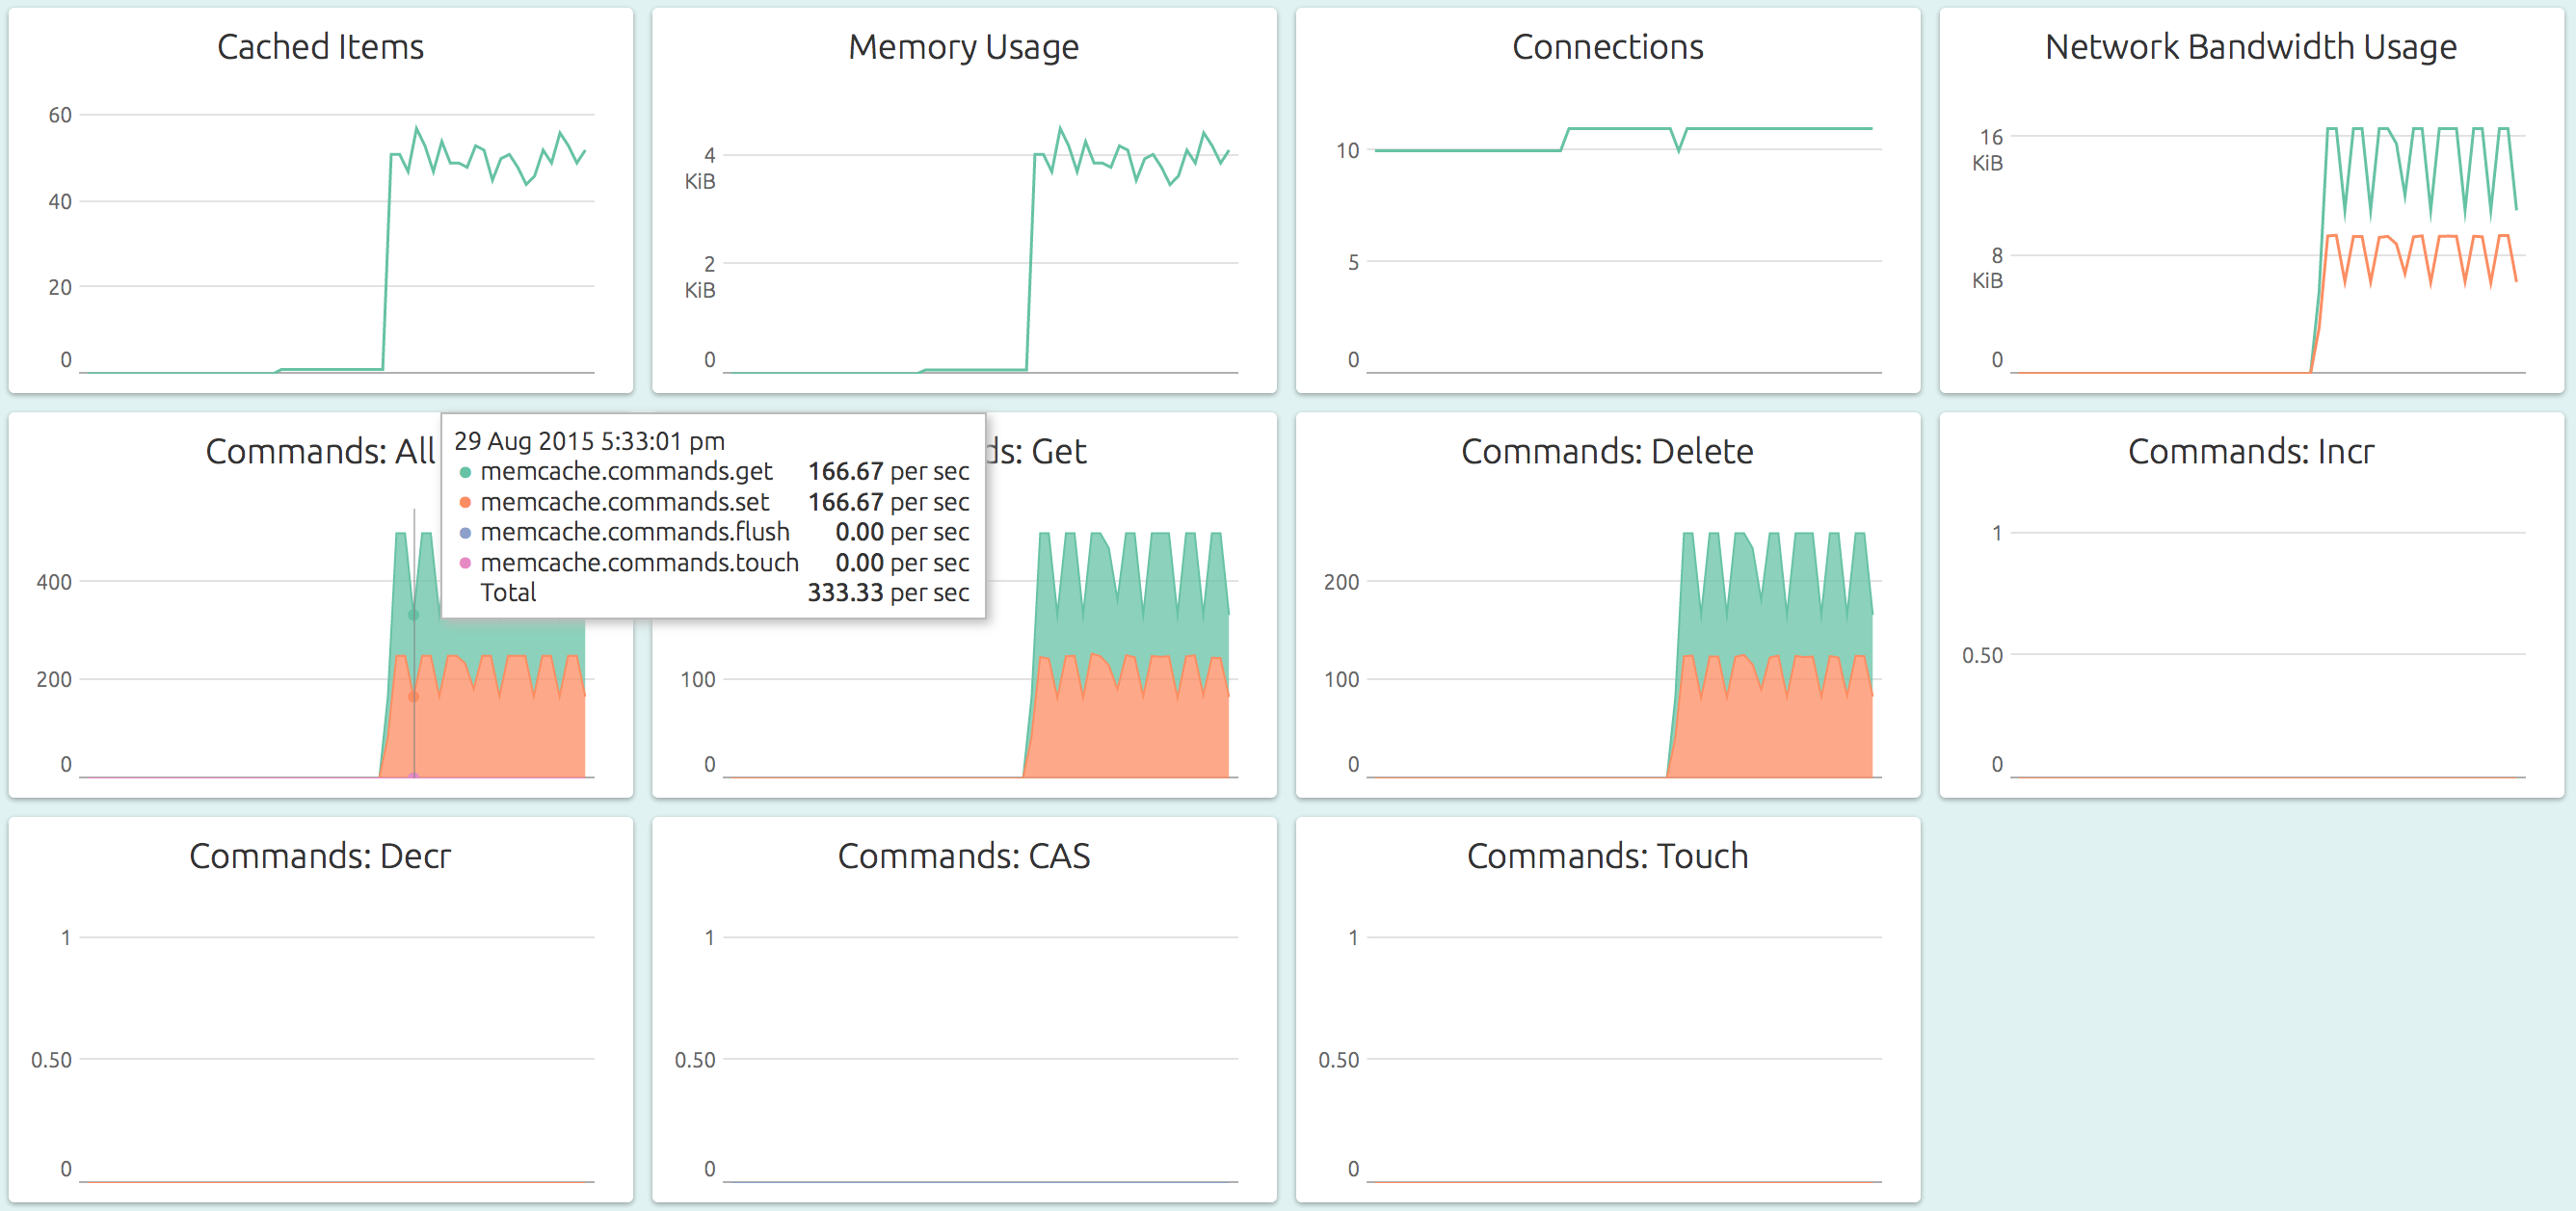
As with Redis, the Memcache dashboard also displays key metrics:
- The Memory Usage and Cached Items track how well the memory is being used as a cache.
- The network related graphs Connections and Network Bandwidth Usage provide insight on how loaded the network is, and answer questions like how soon will this node get bottlenecked on the network?
- The various Command related graphs show detailed information on what types of commands are getting executed and with what cache efficiency.