Redis has become a commonplace fixture in many a stack. It is widely used for caching, queuing, co-ordinating tasks and even for implementing a world-wide shared canvas!
If you use Redis in your stack, read on to see how you can monitor it with OpsDash.
The OpsDash Dashboard
You can configure your OpsDash Smart Agent to monitor any Redis instance by adding a few lines in the configuration file and reloading the agent:
service "my-redis-1" {
    type = "redis"

    # the host to connect to, required
    host = "127.0.0.1"

    # port, optional, defaults to 6379
    # port = 6379
    # password, optional
    # pass = "p@ssw0rd"
}
As you can see, it supports password authentication also.
Without any futher steps, you should be able to see the dashboard for your Redis instance in OpsDash:
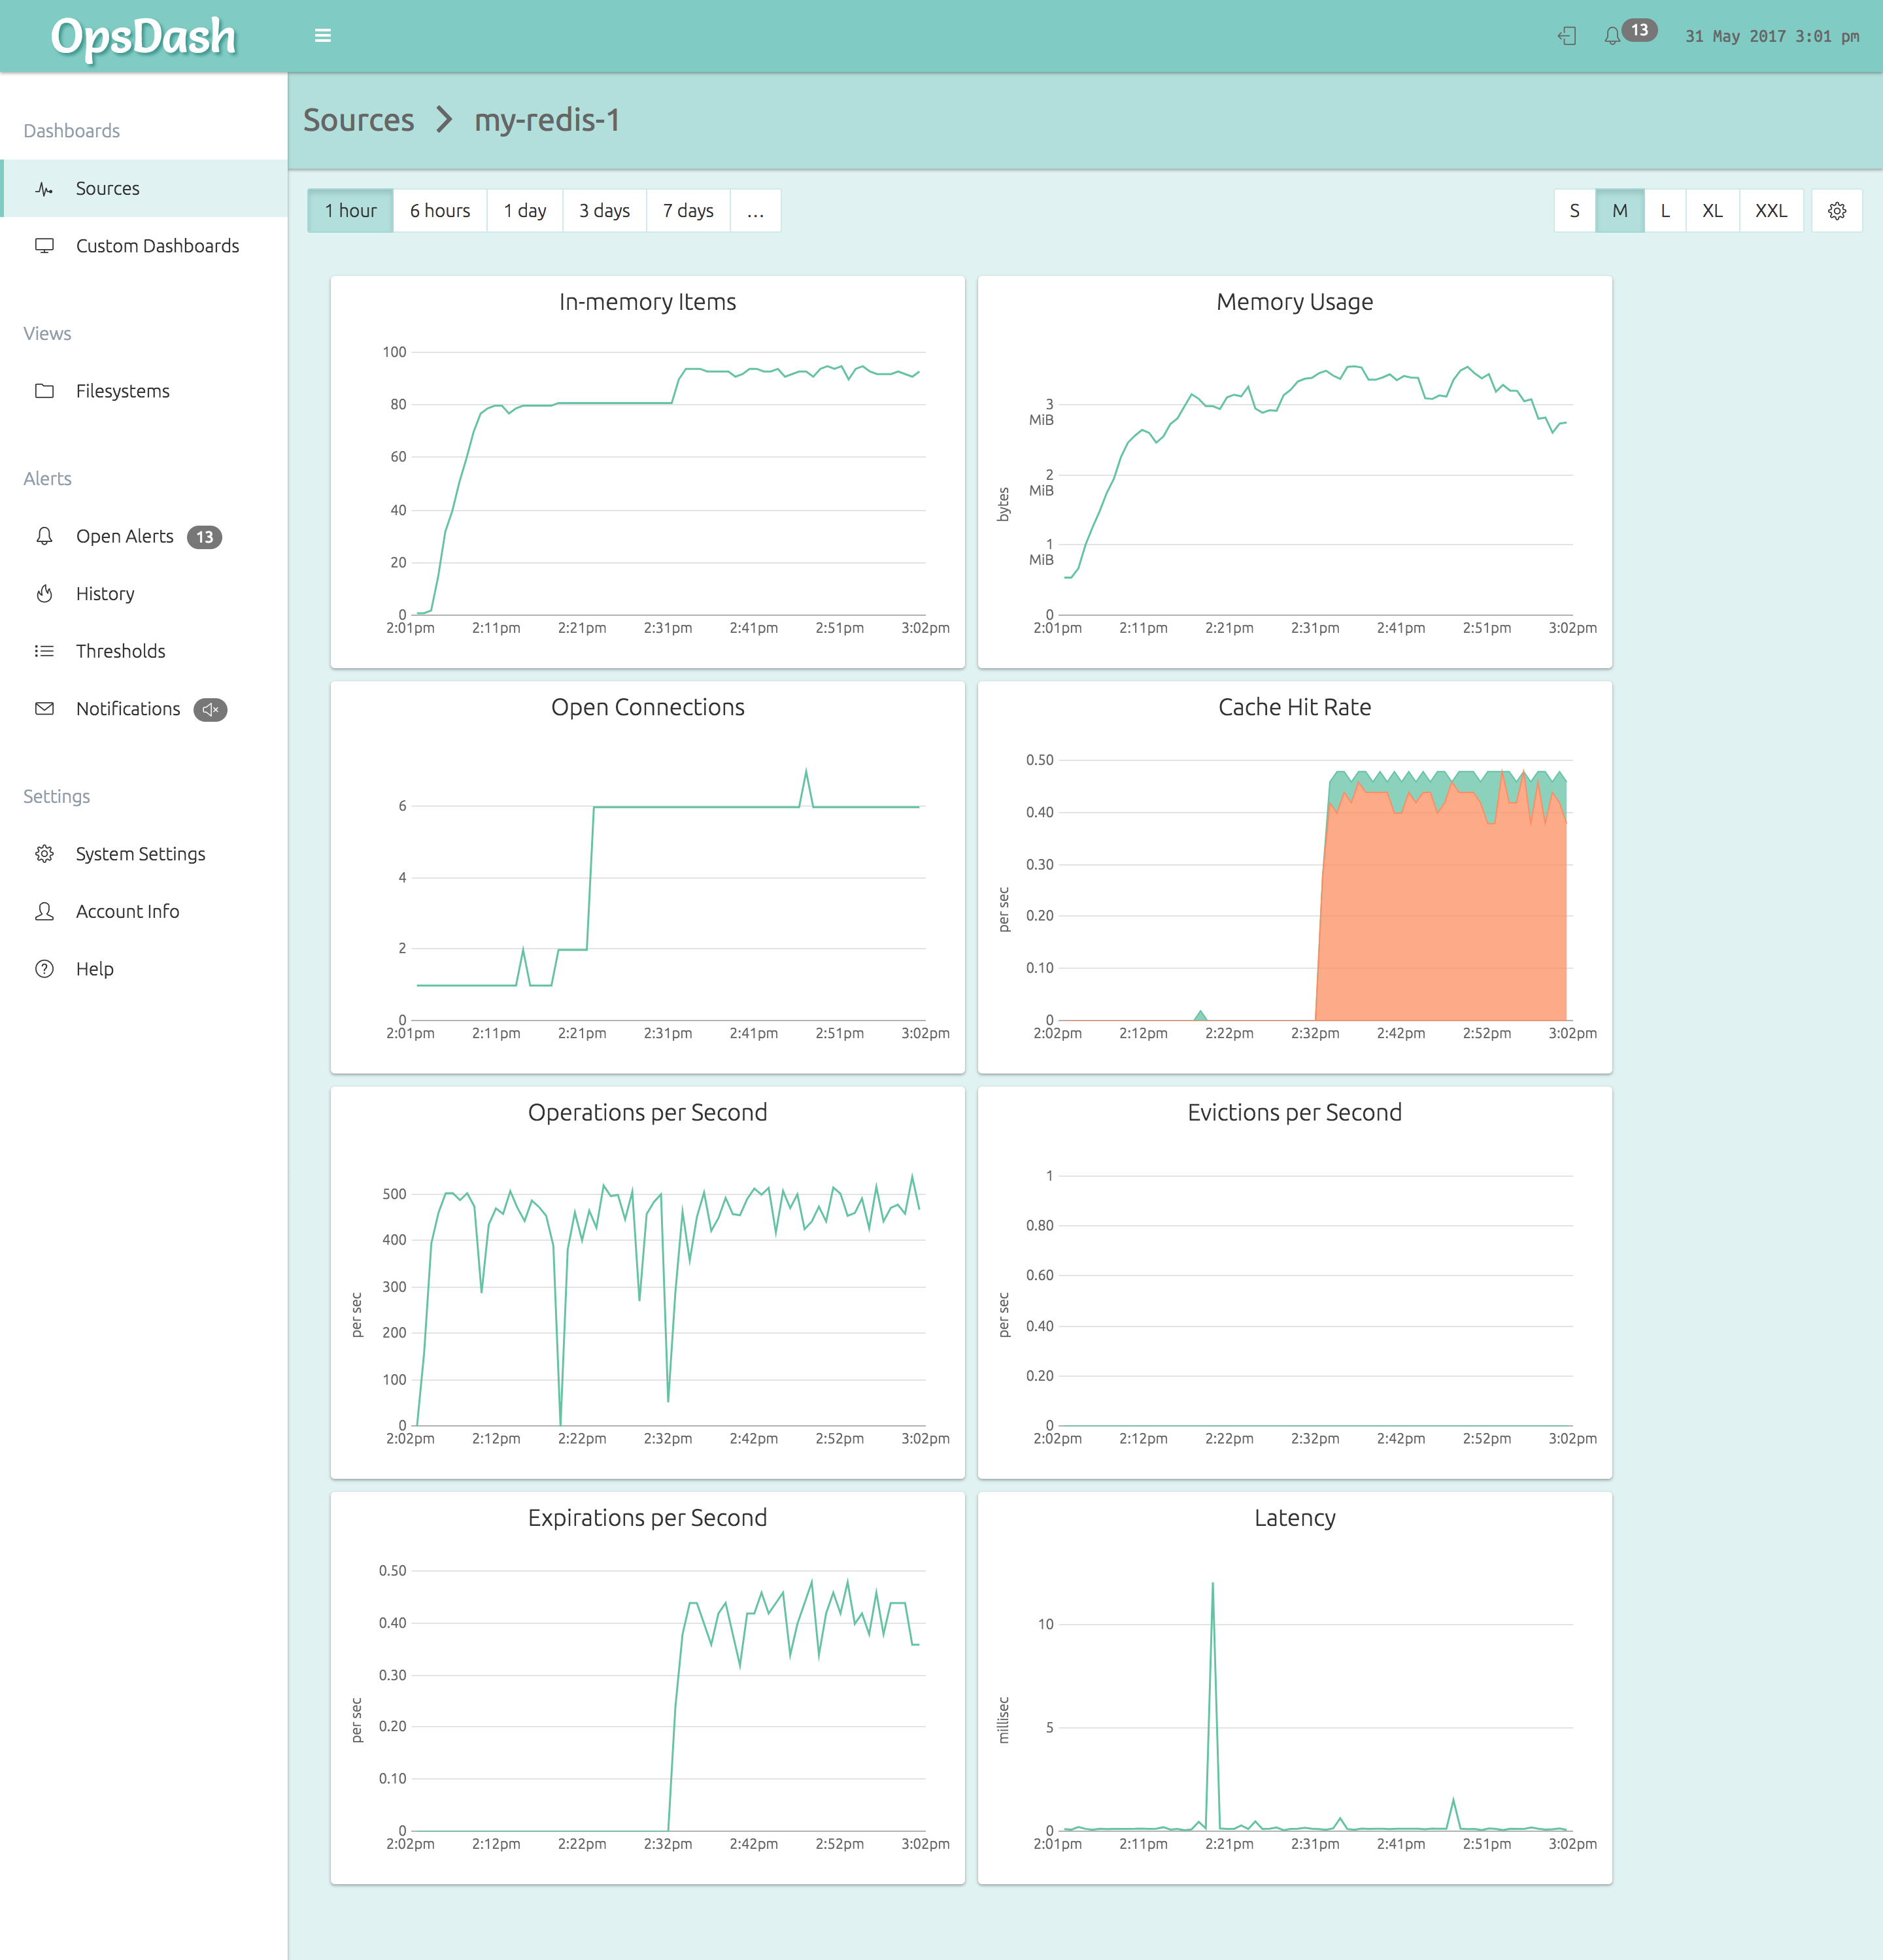
Let’s have a look at the graphs in detail.
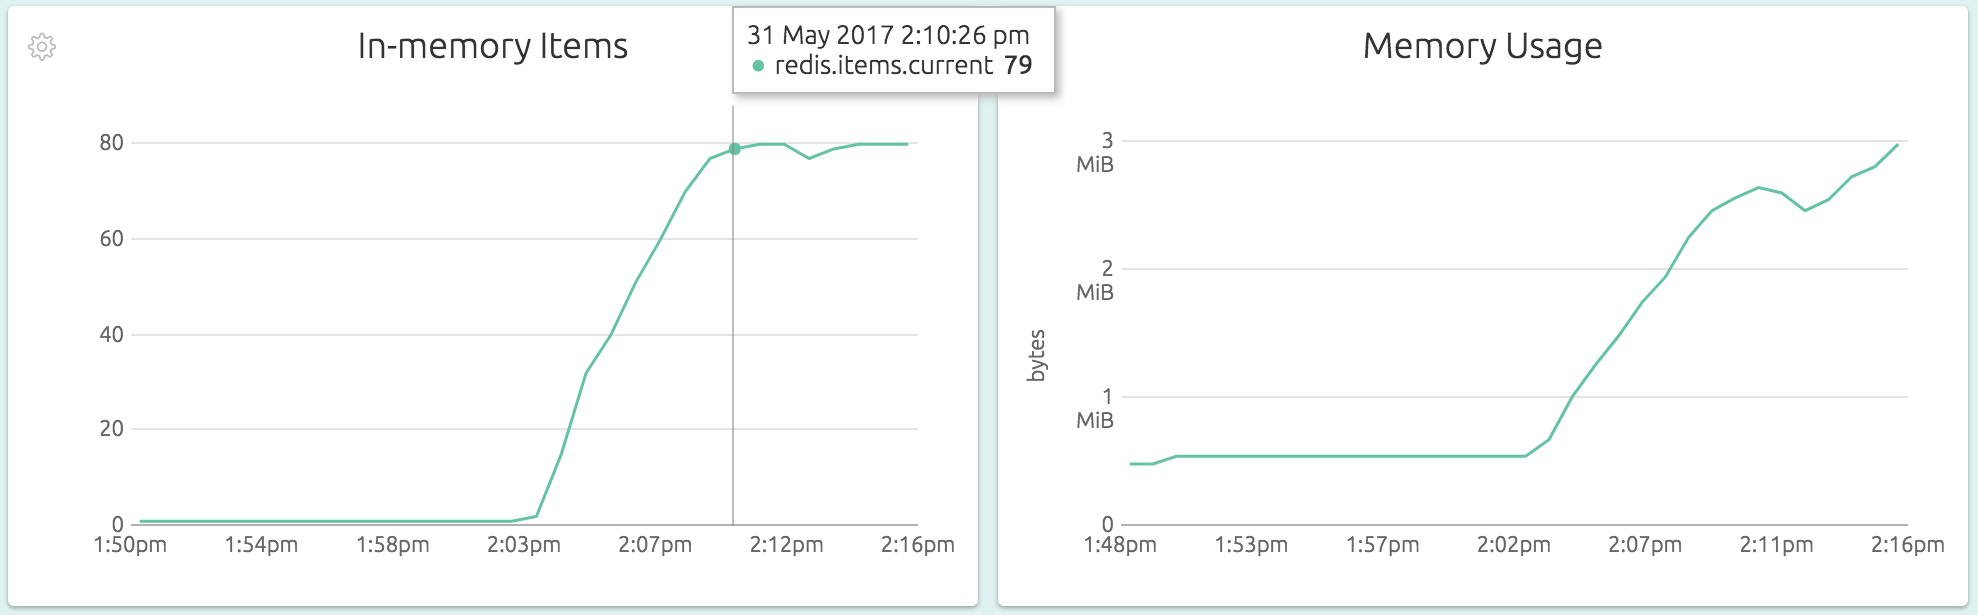
Memory Related
The first couple of graphs give the number of unique items stored and the total memory used (by keys, their values and overhead).
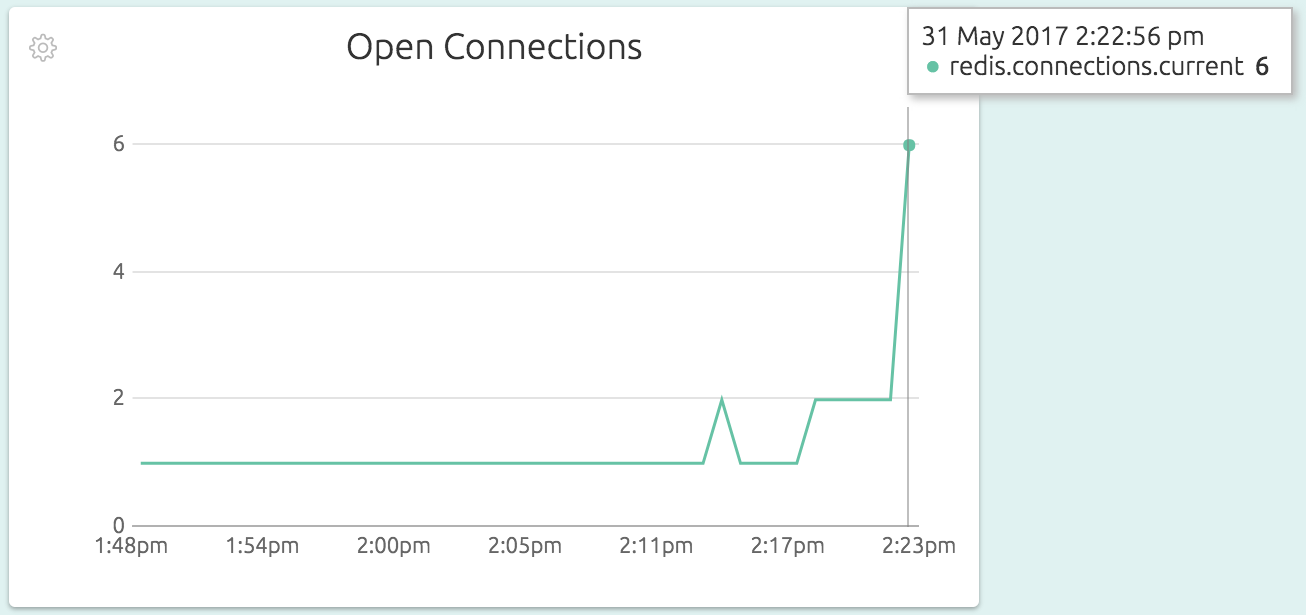
Connections
Clients connect to Redis to fetch or mutate data. Depending on your setup, this might be more or less fixed, or might have periodic upswings. In any case, it is probably a good idea to set threshold alerts on the number of open connections to Redis, to alert you of situations like clients being unable to connect, or if there is an unexpected surge of connections.
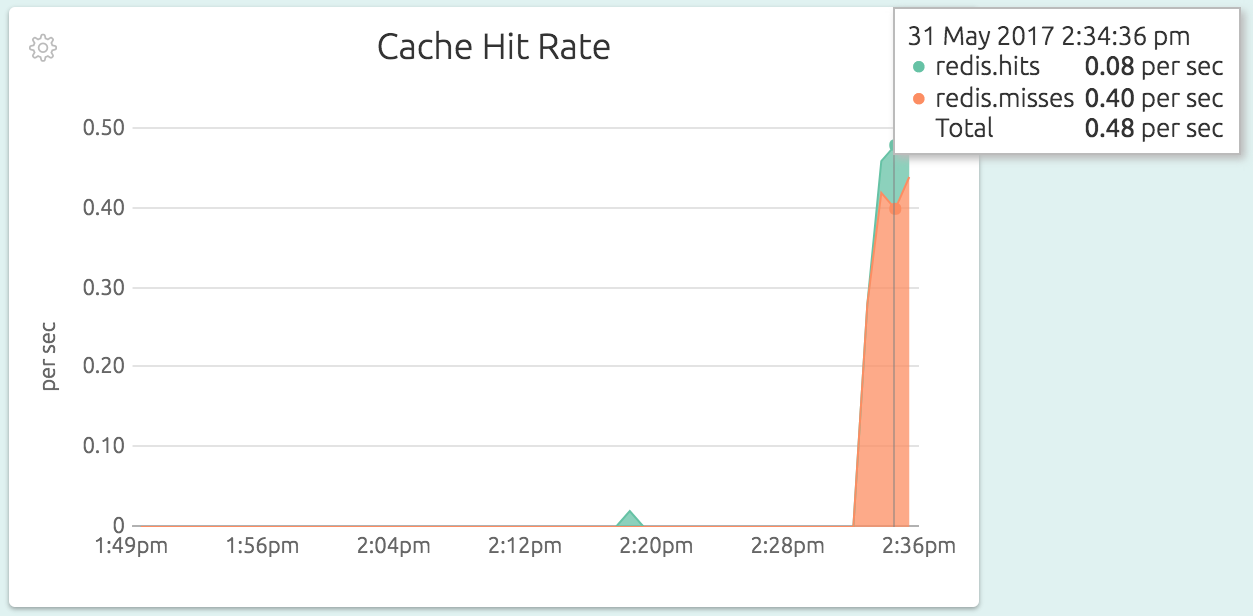
Cache Efficiency
Serving as an in-memory cache is one of the major use cases for Redis. A cache miss can occur if a request key does not exist, or if the key was previously evicted and was on disk when the request came in. The “Cache Hit Rate” graph measures how many keys were available in-memory and how many were not, as a rate:
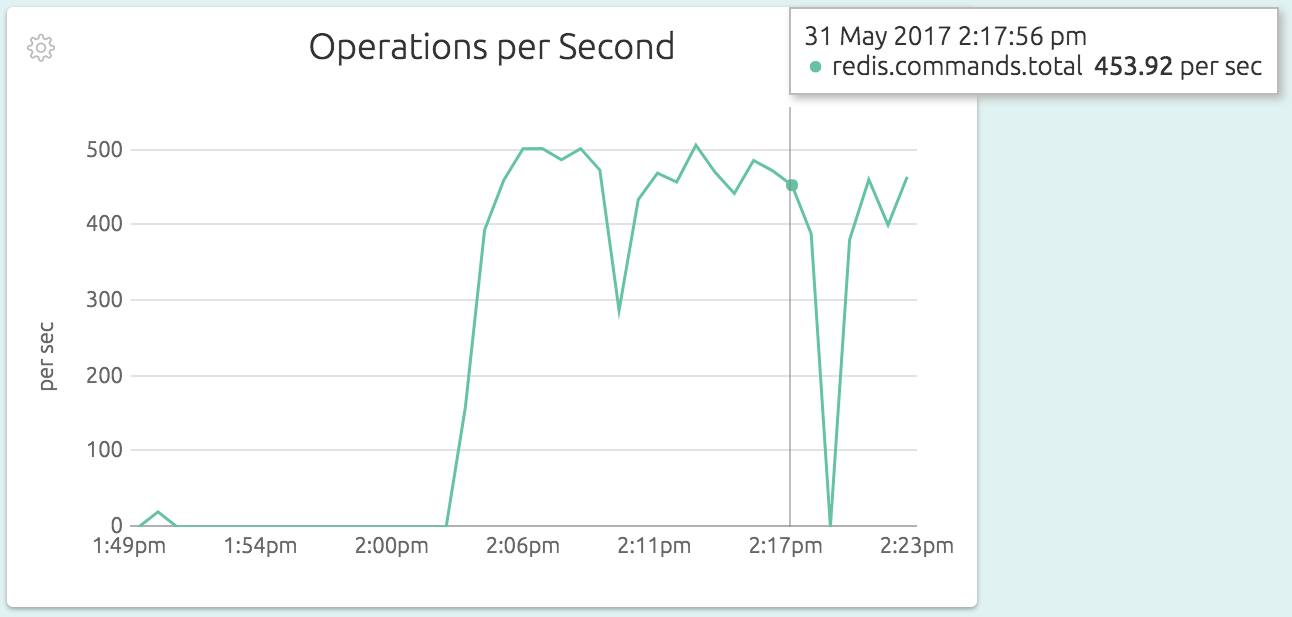
Operations
OpsDash tracks the number of operations that happen per second. This value typically depends on your traffic or activity, and should vary in proportion to that.
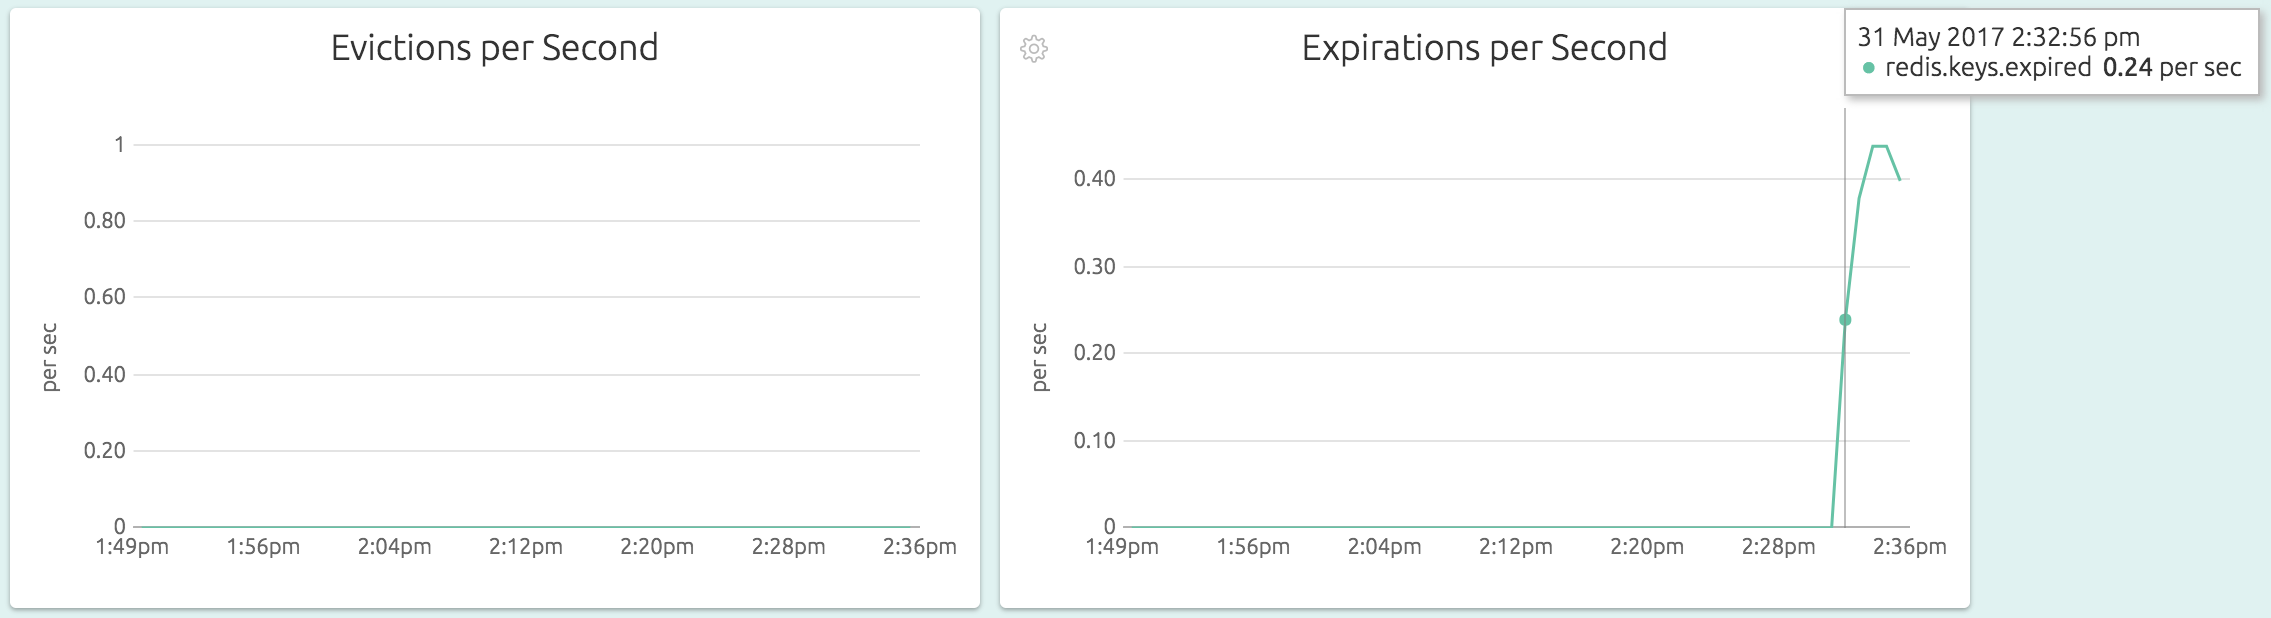
Removal of Keys
In-memory keys can be removed by Redis because of hitting memory limits (see “Using Redis as an LRU cache”). A key can also get removed because it’s TTL expired. OpsDash keeps an eye on both these activities:
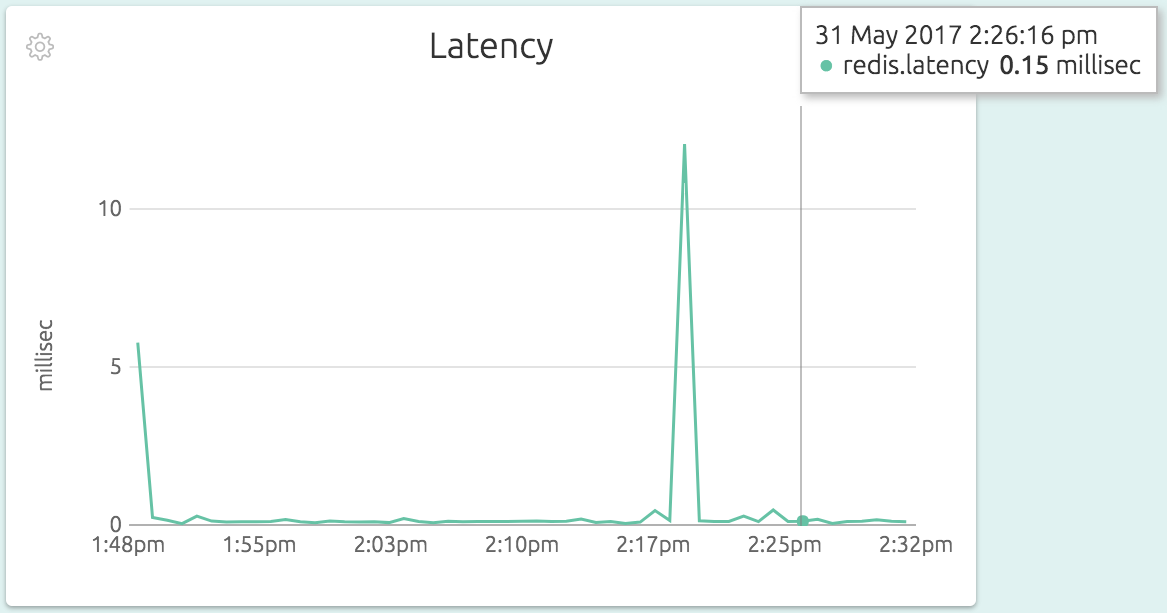
Latency
Finally, OpsDash also tracks the latency incurred in talking to Redis. Since typically you’d run the OpsDash Smart Agent on the same server as Redis, you’d expect the latency to be sub-millisecond. Any increase indicates some serious load on the Redis server.
New Here?
OpsDash is a server monitoring, service monitoring, and database monitoring solution for monitoring MySQL, PostgreSQL, MongoDB, memcache, Redis, Apache, Nginx, Elasticsearch and more. It provides intelligent, customizable dashboards and spam-free alerting via email, HipChat, Slack, PagerDuty and Webhooks. Send in your custom metrics with StatsD and Graphite interfaces built into each agent.