We’re happy to announce the release of OpsDash v1.9 (self-hosted). This release includes: a new page with a consolidated view of all alert thresholds, an option to suppress negative rates of change in any graph, and a number of bug fixes and UI improvements.
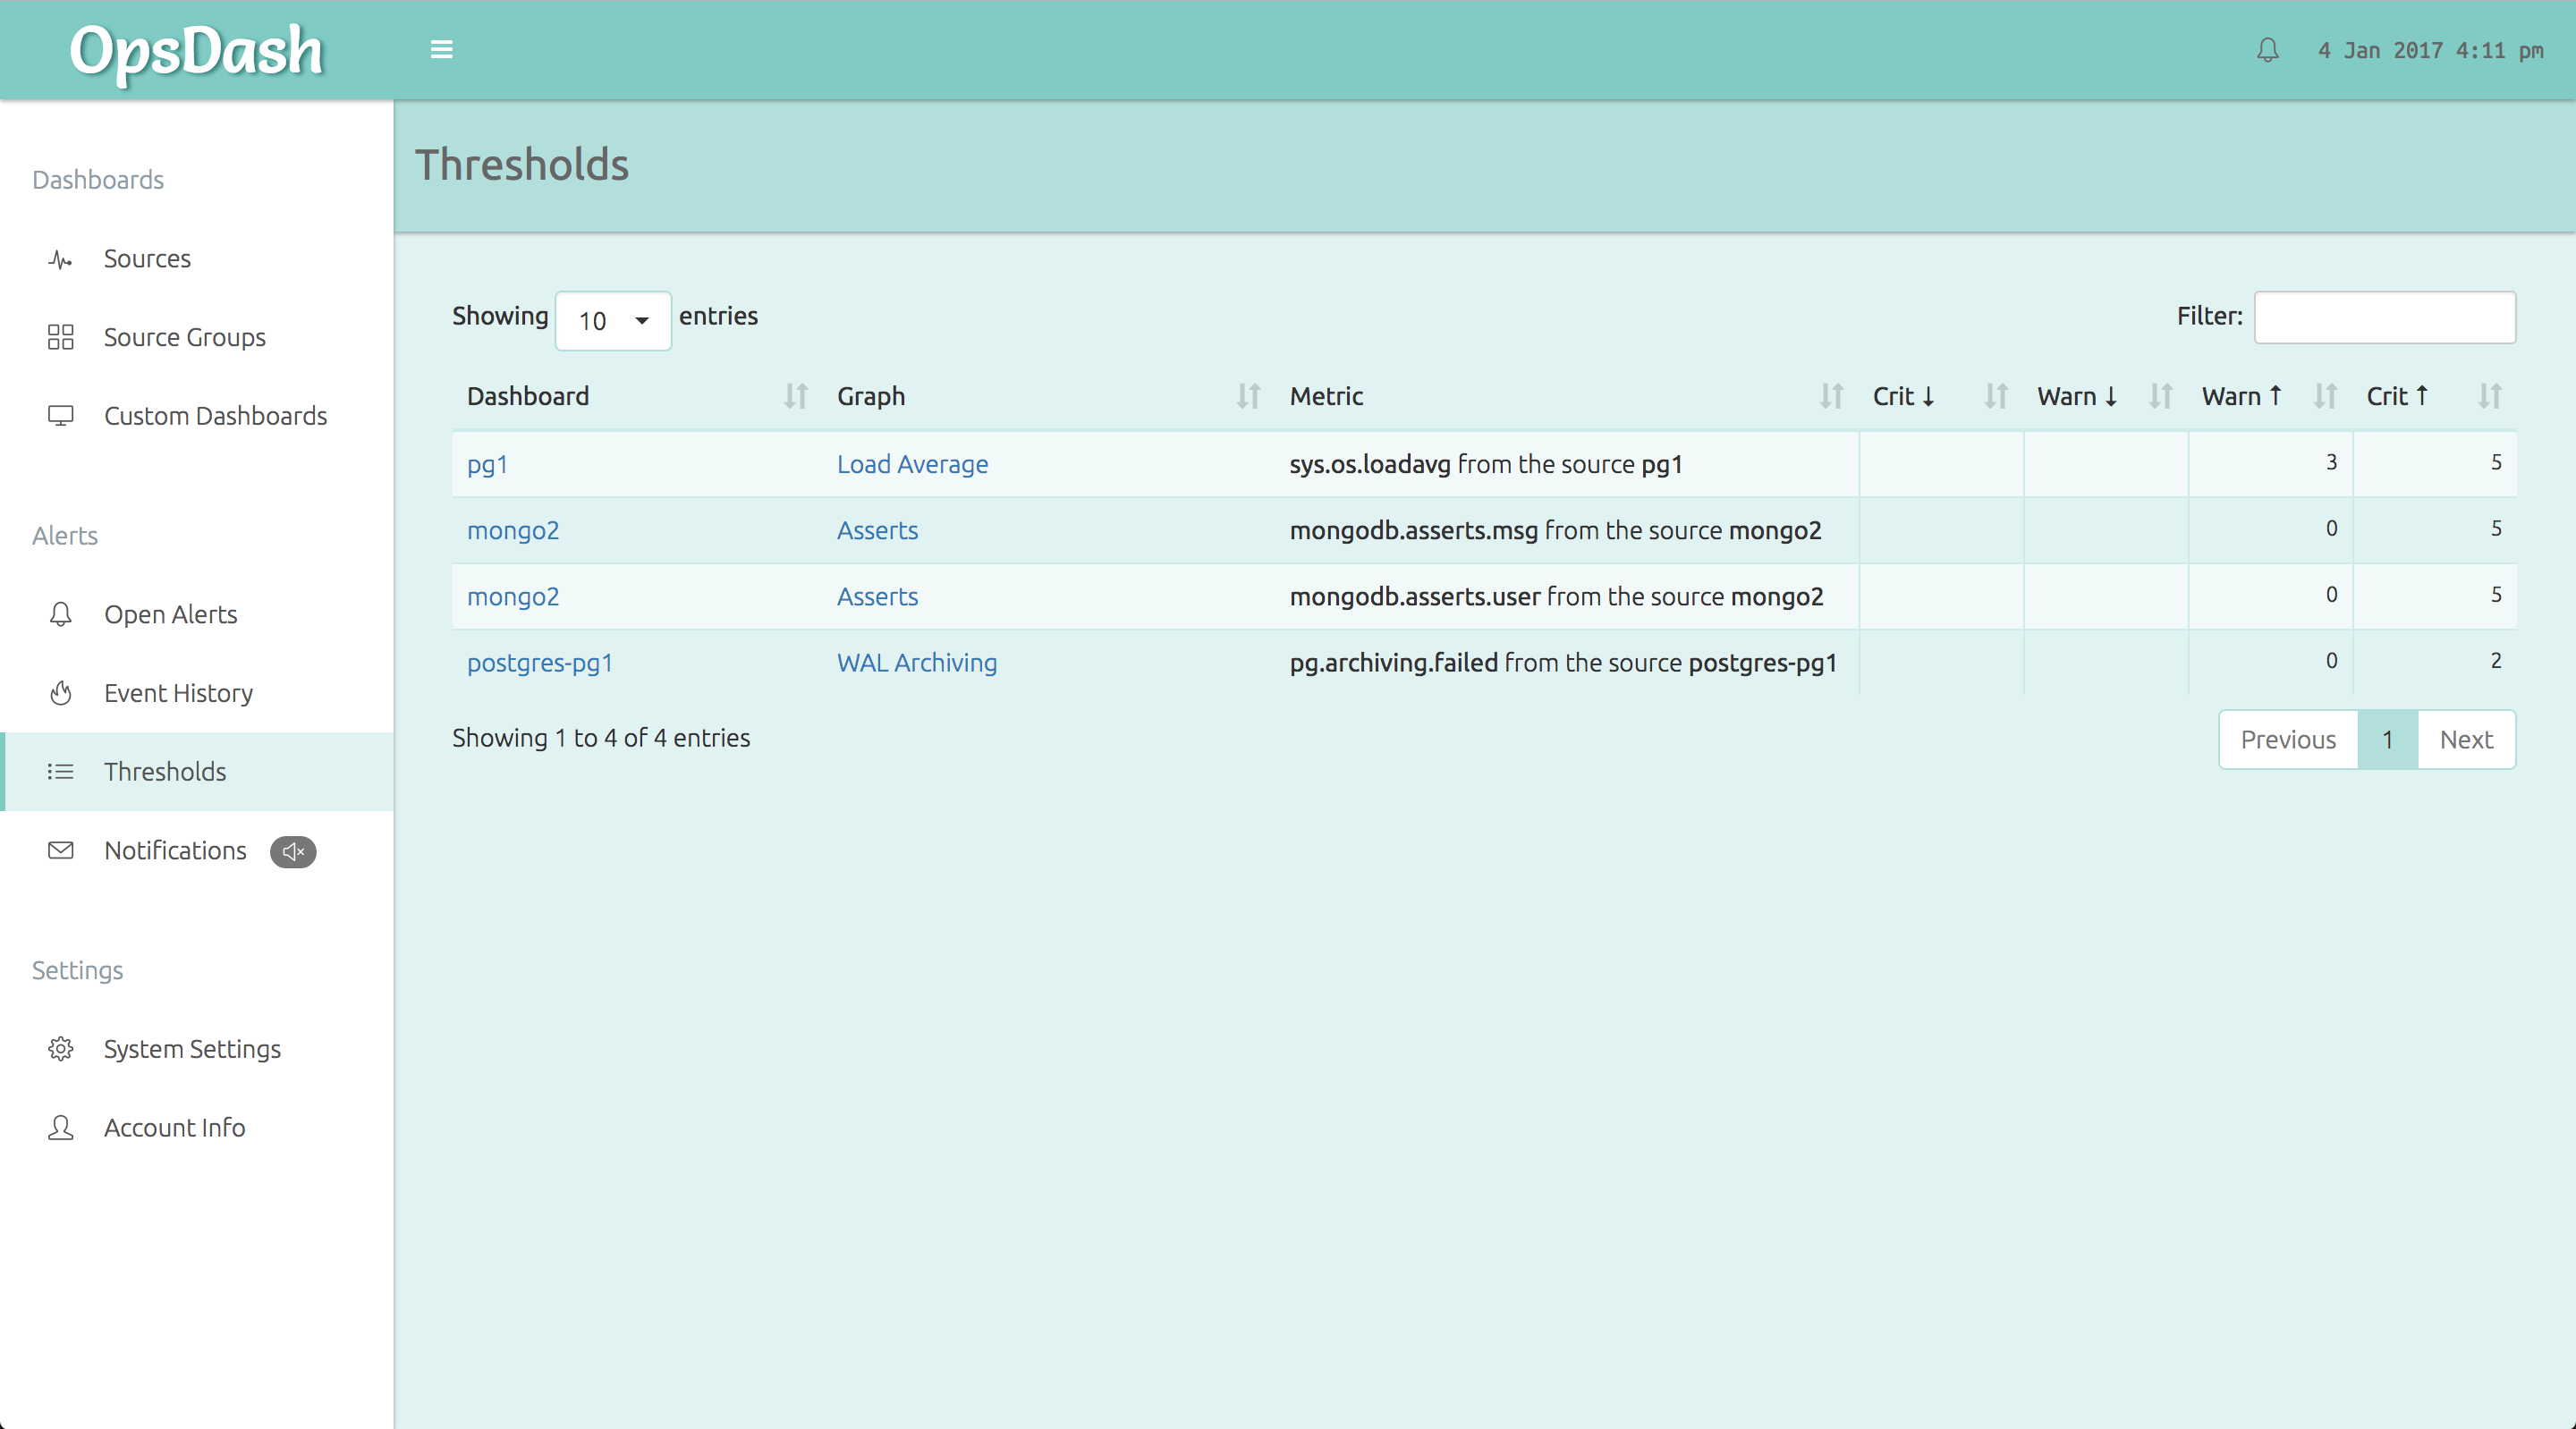
New Alert Thresholds View
You can now get a view of all the alert thresholds you have set across metrics and dashboards in a single page. No need to hunt around, it’s all there in a single view.
Option To Suppress Negative Values
Have rate of change graphs that look a really odd after a restart? Wish you could normalize these? You now have the option to suppress negative values on any graph, with the click of a button.
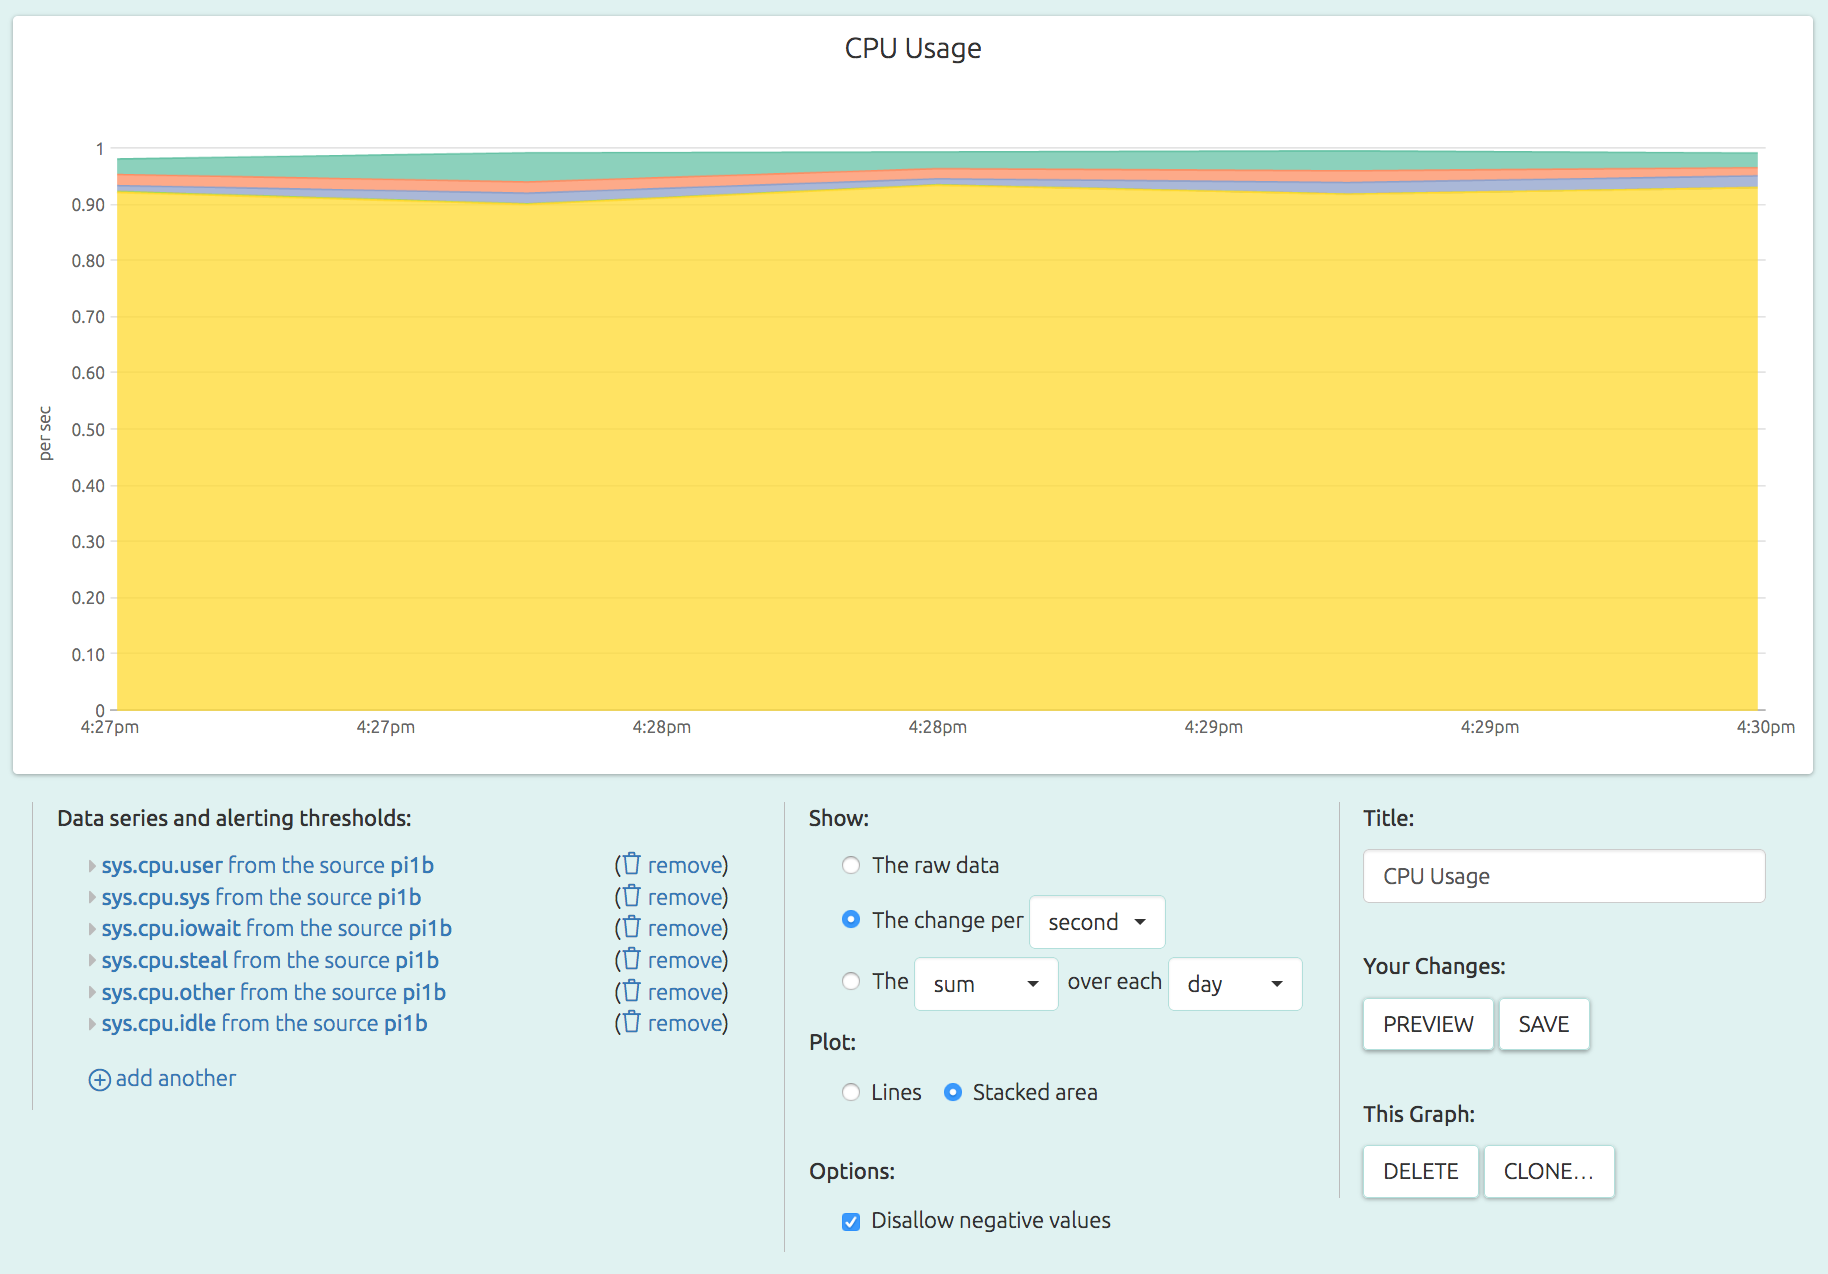
In v1.9, this option will be set by default on graphs where it generally makes sense.
And More!
OpsDash v1.9 comes with a number of highly requested bug fixes and UI improvements. Thanks for the feedback!
Ready to upgrade?
Follow the steps listed here. For this version, we recommend upgrading the agents also to v1.9 (although a v1.9 server can to talk to v1.8 or lower agents).
New Here?
OpsDash is a server monitoring, service monitoring, and database monitoring solution for monitoring MySQL, PostgreSQL, MongoDB, memcache, Redis, Apache, Nginx, HTTP URLs, Elasticsearch and more. It provides intelligent, customizable dashboards and spam-free alerting via email, HipChat, Slack, PagerDuty and PushBullet.
OpsDash is available as a self-hosted, on-premise solution and as a SaaS solution. Choose what’s right for you!
Interested in self-hosted? Start Free today!
Prefer SaaS? Signup for the beta!