HAProxy Monitoring
With OpsDash, you can quickly start monitoring HAProxy, and get instant insight into key metrics. OpsDash dashboards come pre-configured, setup to monitor the most important HAProxy metrics. No messing around with individual metrics, figuring out which of them are important, no editing graph templates.
OpsDash can query your HAProxy stats via stats HTTP URLs or via stats sockets. It also accepts username and password for basic authentication of the HTTP stats URL.
Here’s how OpsDash’s curated dashboards come out of the box:
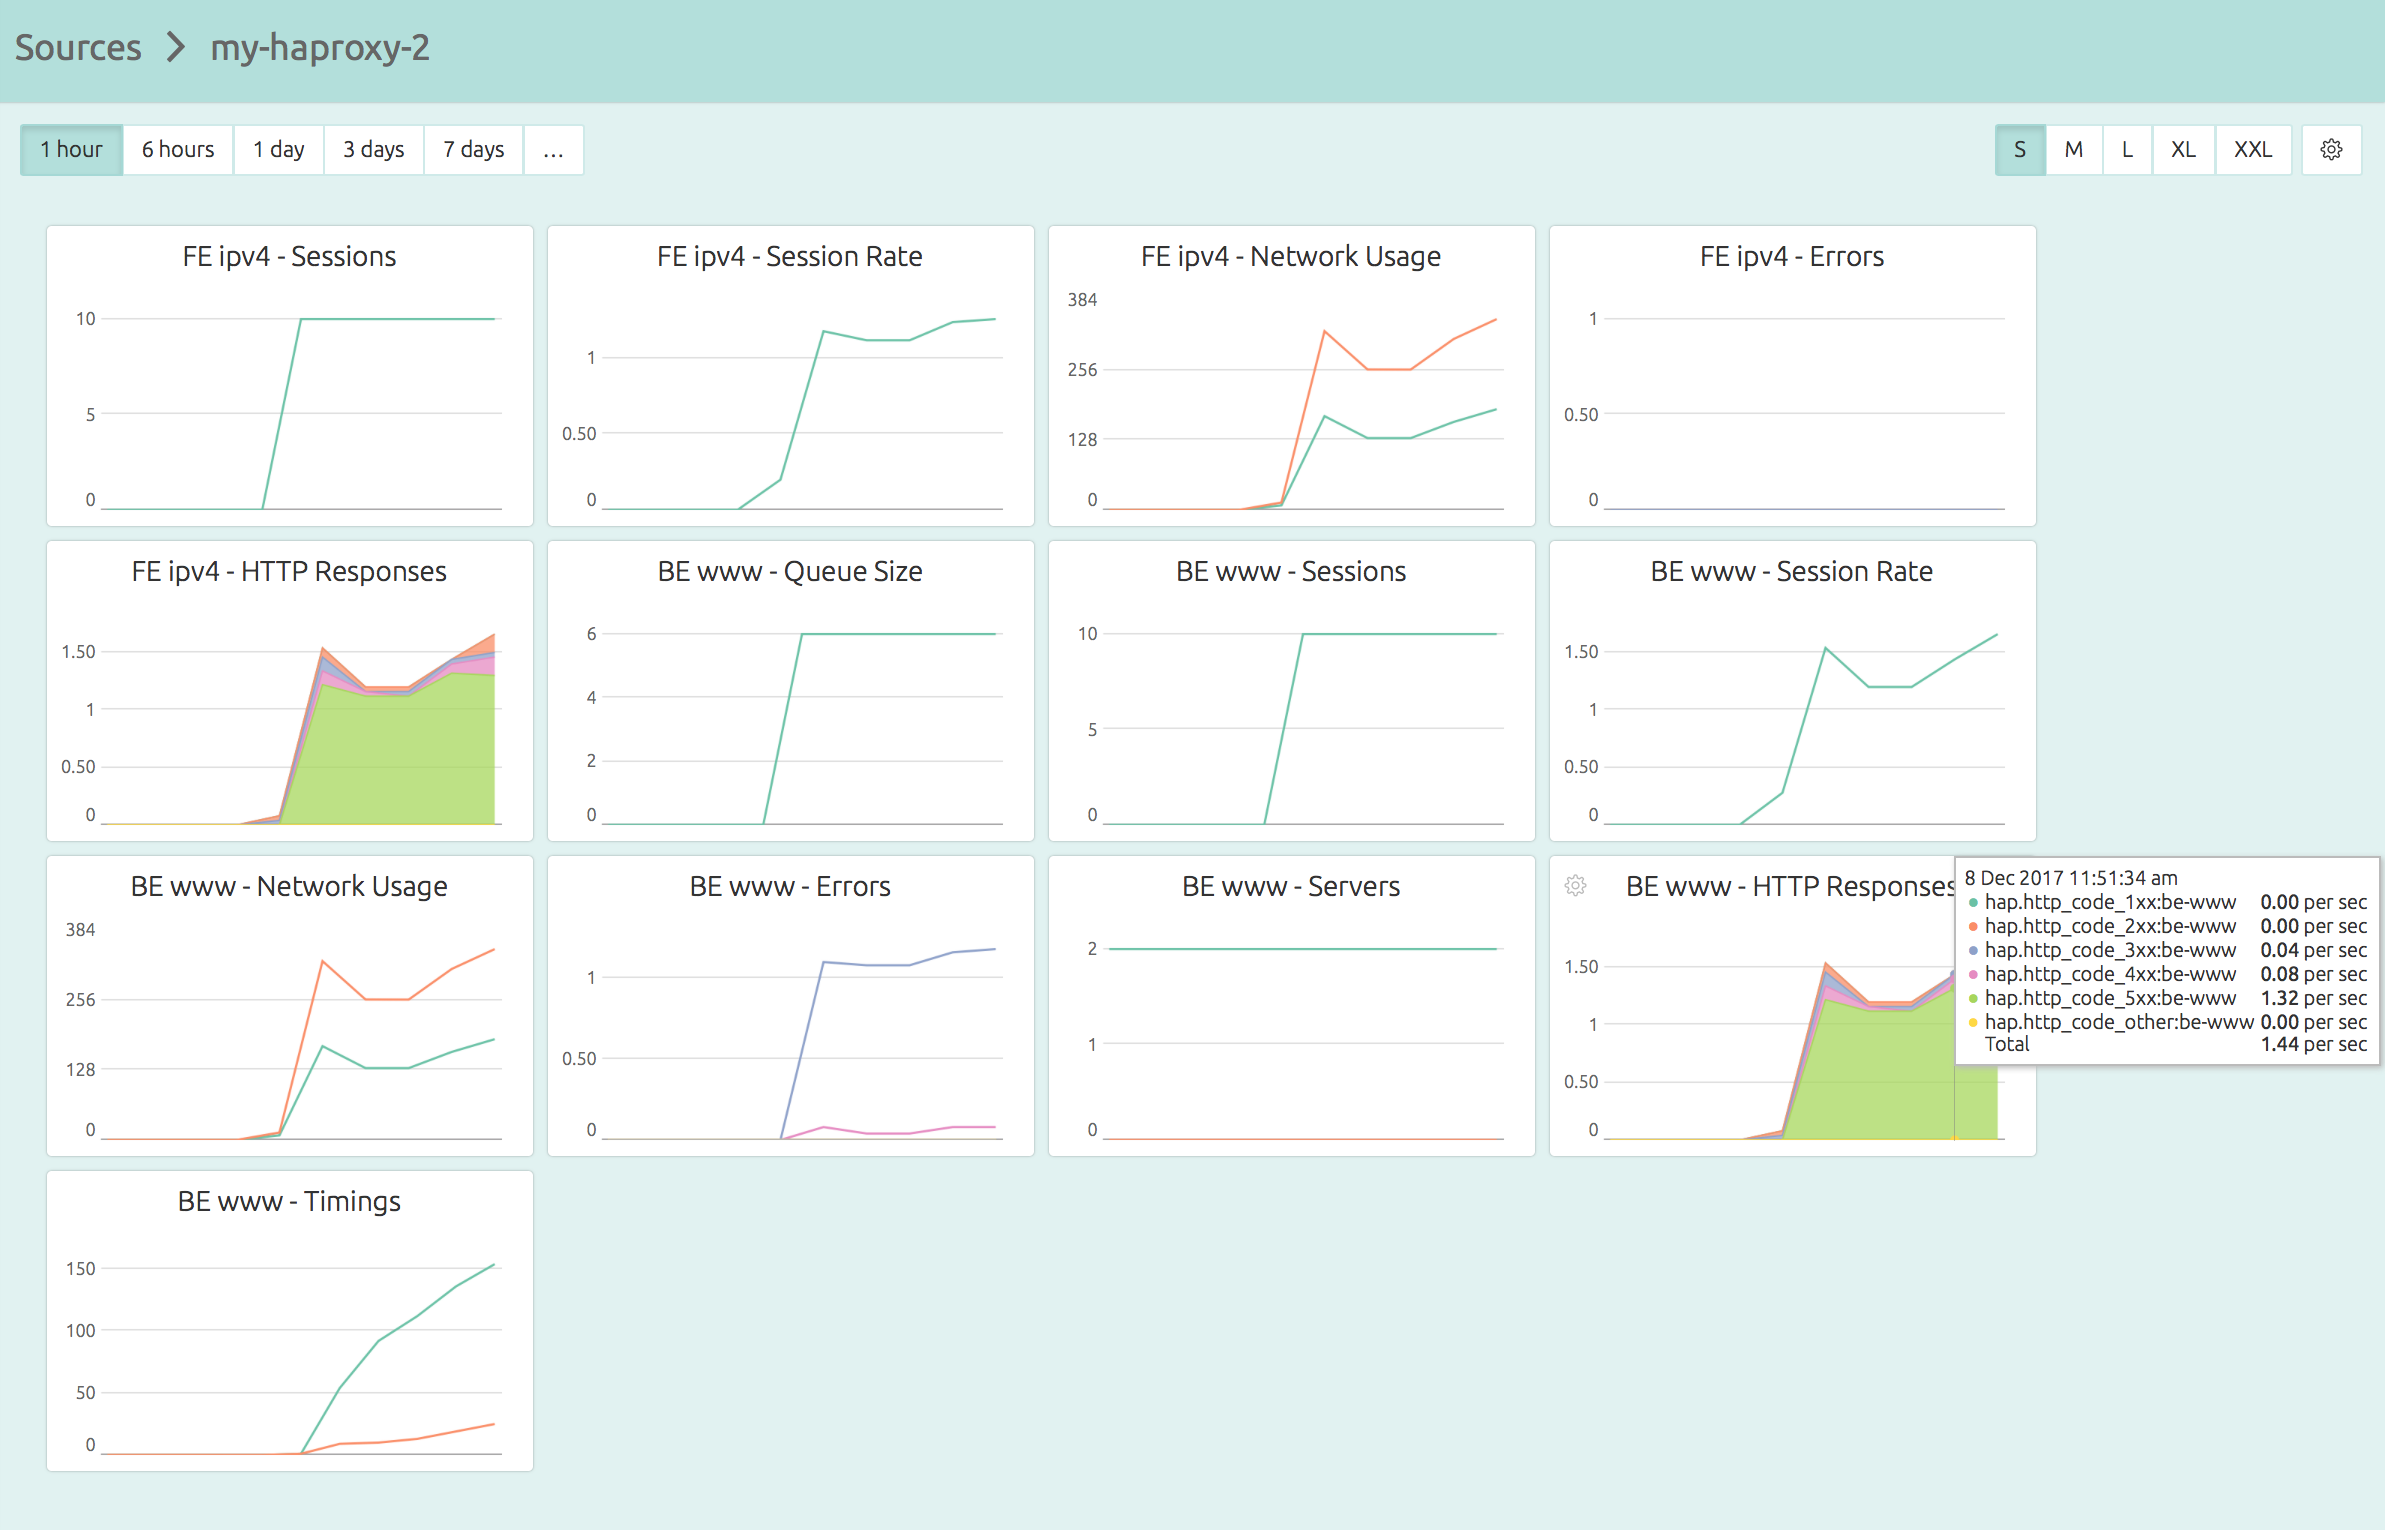
OpsDash HAProxy dashboard has these graphs by default (the frontend "FE" and backend "BE" sections are repeated for each frontend/backend that has been configured in your HAProxy configuration):
- FE {name} - Sessions - The number of sessions currently open for the frontend named "{name}".
- FE {name} - Session Rate - The rate of creation of new sessions for the frontend named "{name}".
- FE {name} - Network Usage - The incoming and outgoing bandwidth usage by the frontend.
- FE {name} - Errors - The front end errors — request denied, response denied, request errors — tracked as rate (errors/sec).
- FE {name} - HTTP Responses - (only for HTTP frontends) The HTTP responses per second, categorized as 1xx, 2xx, 3xx, 4xx, 5xx and other (protocol errors).
- BE {name} - Queue Size - The number of requests currently waiting in queue for the backend named "{name}".
- BE {name} - Sessions - The number of sessions currently open for the backend named "{name}".
- BE {name} - Session Rate - The rate of creation of new sessions for the backend named "{name}".
- BE {name} - Network Usage - The incoming and outgoing bandwidth usage by the backend.
- BE {name} - Errors - The backend errors — request denied, response denied, connection errors, response errors, retries, redispatches, client aborts, server aborts — tracked as rate (errors/sec).
- BE {name} - Servers - The number of active and backup servers for this backend.
- BE {name} - HTTP Responses - (only for HTTP backends) The HTTP responses per second, categorized as 1xx, 2xx, 3xx, 4xx, 5xx and other (protocol errors).
- BE {name} - Timings - (only for HAProxy v1.5+) The moving average of the queue time, and the moving average for the response time (only for HTTP backends).
You’ll want to set warning and critical upper limits for these metrics so that you can identify and address emerging issues before they bite. You can quickly setup your alerts in OpsDash and send notifications by Slack, Hipchat, OpsGenie, VictorOps, PagerDuty or Email.
New here?
OpsDash is a comprehensive solution for server monitoring, service monitoring, database monitoring and application metrics monitoring. You can use OpsDash for monitoring MySQL, PostgreSQL, MongoDB, memcache, Redis, Apache, Nginx, Elasticsearch and more. It provides intelligent, customizable dashboards and spam-free alerting via email, HipChat, Slack, PagerDuty, OpsGenie, VictorOps and Webhooks. Send in your custom metrics with StatsD and Graphite interfaces built into each agent.