How do you get your Go application’s metrics – like say the execution time for a particular SQL query or an error rate – out of your app and into a monitoring and alerting system?
Let’s check out the popular options.
Push vs. Pull
Broadly, all methods fall into either the “push” or the “pull” category. The push category methods rely on an active component within your application to push the metrics into a monitoring system. In the pull model, the application has to expose the metrics in some form, which is then scraped or pulled by the monitoring system.
There are definite pros and cons for each approach, and you’ll have to evaluate what suits you best before choosing one.
The Push Model
In the push model, you’ll typically push your metric into a channel, from where it is picked up by a goroutine that will dispatch it to the monitoring system, usually over the network. In terms of code, something along these lines:
var fooCount = 0

func foo() {
    // ... do stuff ...

    fooCount += 1
    metricsChan <- Metrics{"foo.count", fooCount, CounterType}
}

var metricsChan = make(chan Metrics, 1000)

func metricsPusher() { // run as a goroutine
    for m := range metricsChan {
        // send m to the monitoring system
    }
}
There are a few things that the metricsPusher will have to handle:
- Service Discovery: How does the application know where the monitoring system is located? For example, if you are reporting metrics to a StatsD server, all your app instances should know the StatsD server hostname/IP.
- Retry Policy: The sender should have some logic to handle intermittent network disruptions and delays.
- Backlog Management: In the pseudo-code above, the buffered channel had a size of 1000. When dealing with high metric volume, the sender should actively manage this backlog. Cases like production rate higher than dispatch rate, backlog filling up and memory consumption of backlog should be handled.
- Batching: For most systems, it is efficient to batch multiple requests into one, thereby avoiding multiple round trips. The sender should make use of batching if possible.
The Pull Model
In the pull model, the application exposes it’s metrics typically as an HTTP
endpoint. All the application metrics can be retrieved from this endpoint in
structured plain text, json, protocol buffer or other formats. In terms of code,
pull model looks like this (using expvars):
import _ "expvar"

var fooCount = expvar.NewInt("foo.count")

func foo() {
    // ... do stuff ...

    fooCount.Add(1)
}

func main() {
    http.ListenAndServe(":8080", nil)
    // http://localhost:8080/debug/vars has the metrics
}
There is a global set of metrics, typically maintained in-memory as a
goroutine-safe map, which can be mutated by application code. The HTTP server
simply renders all these metrics in the required format.
Compared to the push model, the pull model has some differences:
- Lower Application Cost: The cost of memory and CPU at application side is proportional to the number of metrics, not the rate of production of metrics.
- No Application-side Service Discovery: The task of discovering the HTTP endpoints to be monitored is shifted to the monitoring system side.
- Risk of Lost Outliers: If an outlier occurs within two pulls, it will be missed by the monitoring system.
- No Events: Typically, it is not possible to report one-shot events (like a “reload” or “deploy”) using the pull mechanism.
Now let’s have a look at the three most popular methods of application metrics reporting from Go: expvar, Prometheus and StatsD.
expvar
The expvar package is included in the Go
standard library. It adds a handler into the default HTTP server (which you have
to start explicitly), and serves up the metrics at the /debug/vars endpoint.
It’s fairly easy to add expvars instrumentation to your application:
import _ "expvar"

var fooCount = expvar.NewInt("foo.count")
var systemTemp = expvar.NewFloat("system.temp")

func foo() {
    // ... do stuff ...

    fooCount.Add(1)

    systemTemp.Set(temperature)
}

func main() {
    http.ListenAndServe(":8080", nil)
}
The metrics are made available in JSON format. There is no one single canonical collector for expvars.
Prometheus
Prometheus is a modern, pull-based monitoring system rapidly gaining in popularity. It comes with a client-side library for Go, which is similar to expvar.
Here is how the code looks for Prometheus instrumentation:
import (
    "github.com/prometheus/client_golang/prometheus"
    "github.com/prometheus/client_golang/prometheus/promhttp"
)

var fooCount = prometheus.NewCounter(prometheus.CounterOpts{
    Name: "foo_total",
    Help: "Number of foo successfully processed.",
})

func foo() {
    // .. do stuff ..
    fooCount.Add(1)
}

func main() {
    prometheus.MustRegister(fooCount)

    http.Handle("/metrics", promhttp.Handler())
    http.ListenAndServe(":9090", nil)
}
The endpoint is set to /metrics by convention. Unlike expvar, the HTTP handler
for Prometheus is available and can be attached to any HTTP server.
Prometheus also supports different types of metrics, including client-side histograms. For more information, see the Prometheus documentation.
StatsD
StatsD has mostly become the defacto standard for the push method of reporting metrics.
Typically, a StatsD-compatible daemon is installed in each server which aggregates and forwards metrics to the real monitoring system. This simplifies the process of service discovery (always localhost), and efficiency (app only needs to talk to localhost).
This blog post covers using StatsD in more detail.
StatsD and the OpsDash Smart Agent
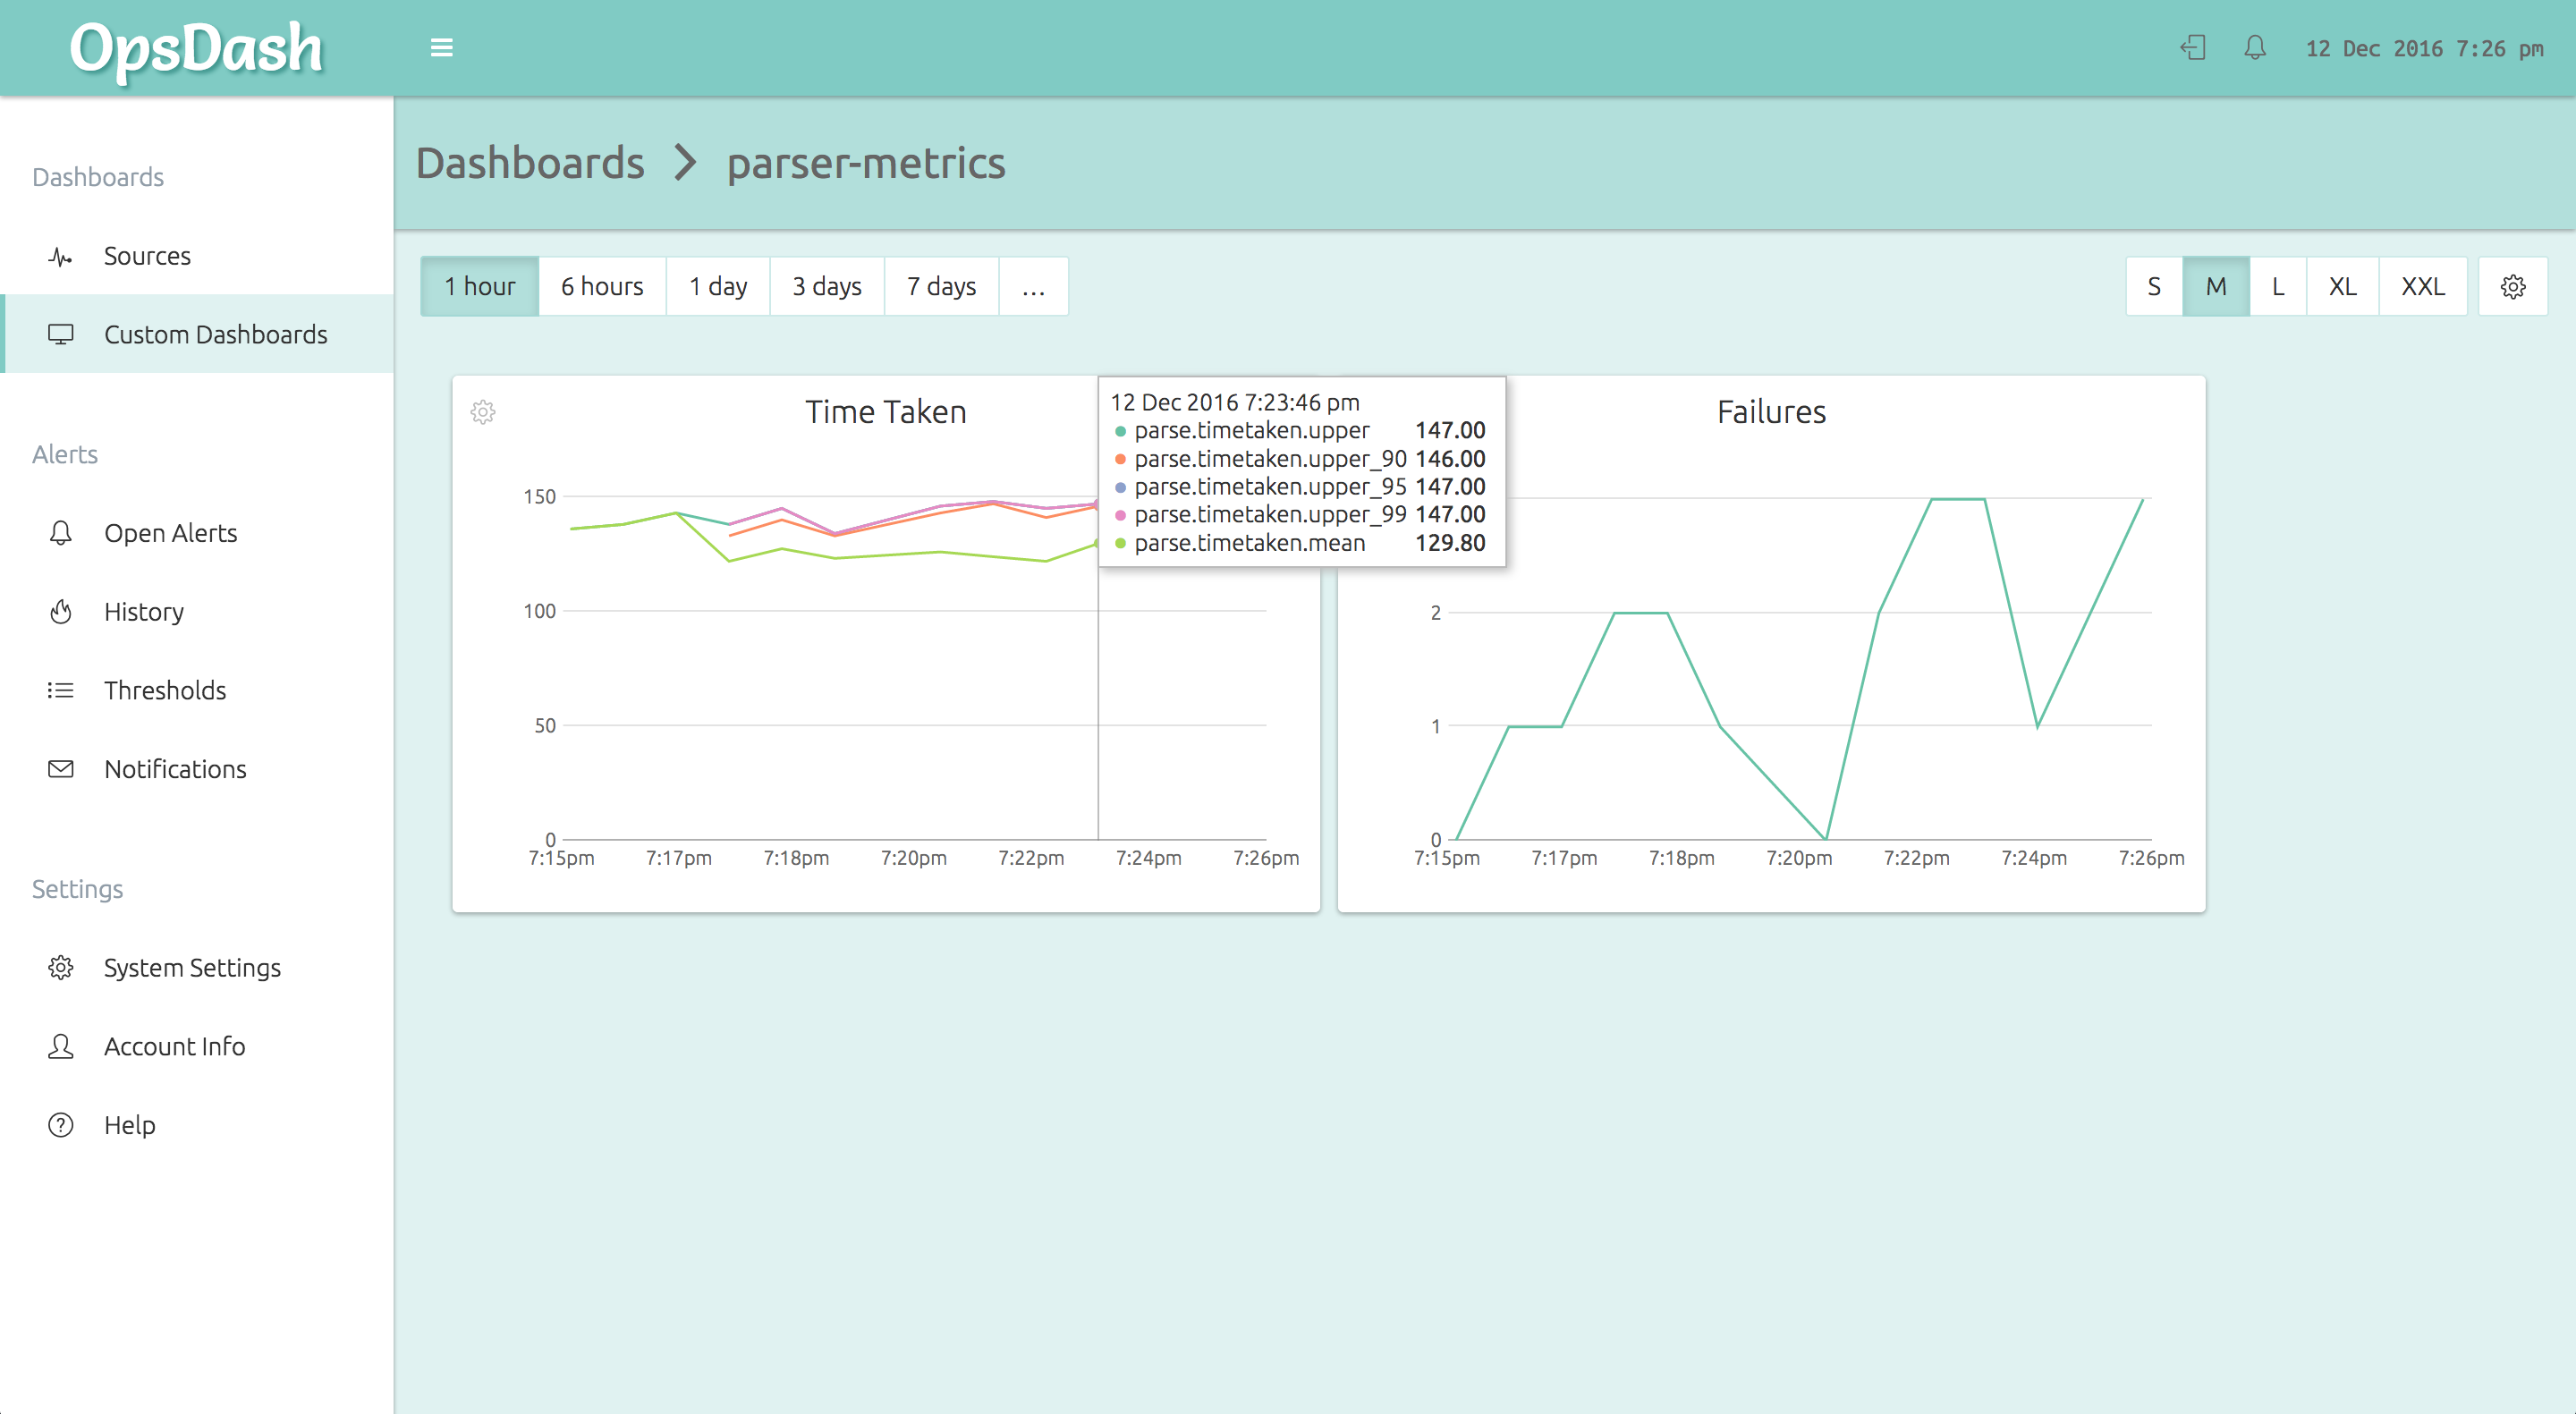
OpsDash supports collecting of app metrics via StatsD and graphite. The OpsDash Smart Agent includes built-in StatsD and graphite daemons.
The OpsDash Smart Agent runs on each node and accepts the StatsD metrics from the application code. It then forwards it to the OpsDash SaaS server, where it can be graphed and alerted upon. Here is an OpsDash custom dashboard showing such example app metrics:
Further Reading
- Google’s SRE Book has more about how they monitor their systems.
- Prometheus is an open-source pull-based metrics collection and storage system.
- StatsD was developed by Etsy. It has a great ecosystem around it.
- Graphite (full docs here) has been around for a long time. It supports storage and post-facto aggregation of metrics.
- OpsDash provides simple, powerful and affordable server and app metric monitoring. Signup here and checkout the pricing here.