Patroni is a tool for deploying PostgreSQL servers in high-availability configurations. Read on to get your feet wet with Patroni.
This post assumes you are familiar with PostgreSQL streaming replication, as well as replication toplogies.
Patroni
Patroni is a fork of the now-unmaintained Governor from Compose. It is open source (GitHub repo) and is documented here. Among other things, Patroni supports bootstrapping, synchronous standbys, automatic failover and maximum replication lag limit on failover.
Patroni needs a distributed configuration manager for coordinating it’s actions, and supports ZooKeeper, etcd and consul. Patroni itself is written in Python and available on PyPi.
Let’s see how to setup an etcd-based Patroni to manage a primary-standby PostgreSQL cluster. Practically, you’d have a 3-node or 5-node etcd cluster, and the primary and standby on separate servers. However, we’re only interested in getting a working Patroni setup so we can explore further, so we’ll set everything up on a single server.
The commands below are for Debian 9, you should be able to use similar or same commands on other distros too.
Setup etcd
etcd is available from it’s GitHub releases page. Let’s download it and run it:
wget https://github.com/coreos/etcd/releases/download/v3.3.2/etcd-v3.3.2-linux-amd64.tar.gz
tar xvf etcd-v3.3.2-linux-amd64.tar.gz
cd etcd-v3.3.2-linux-amd64
./etcd
This will start and run etcd in the foreground. (Use ^C to exit.) etcd is being run as a single-node cluster, which is useless from a redundancy perspective but is good enough for experimentation and development use.
Install Patroni
Patroni and it’s dependencies are installed via pip:
sudo pip install patroni[etcd]The command is to be typed in verbatim, including the square brackets.
If you don’t have pip, you can install it with apt-get:
sudo apt-get install python-pipOn RHEL/CentOS-based distros, you’ll need to “sudo yum install epel-release python-pip gcc”
before you can pip install.
Installing Postgres
Obviously, the Postgres binaries must be present on the system. You can install the Postgres that your distro bundles, or follow the instructions on the Postgres download page. Patroni does not appear to be too dependent on the Postgres version.
For this example, we’ll use the 9.6 version included in Debian 9:
sudo apt-get install postgresql-9.6Which ever method and version you choose, make a note of the path for the Postgres binaries, we’ll need this later. In this case, the path is:
/usr/lib/postgresql/9.6/binPatroni Configuration Files
Patroni is invoked with the path to a configuration file. We’ll have two configuration files, one for the primary and one for the slave. We’ll run both on the same server, on different ports (5432 and 5433).
We’ll call the nodes “pg-1” and “pg-2”. They each have their own configuration files. Here is the first one, “pg-1.yml”:
scope: my-ha-cluster
name: pg-1

restapi:
  listen: 0.0.0.0:8008
  connect_address: 127.0.0.1:8008

etcd:
  host: 127.0.0.1:2379

bootstrap:
  dcs:
    ttl: 30
    loop_wait: 10
    retry_timeout: 10
    maximum_lag_on_failover: 1048576
    postgresql:
      use_pg_rewind: true
      use_slots: true
      parameters:
        wal_level: replica
        hot_standby: "on"
        wal_keep_segments: 8
        max_wal_senders: 5
        max_replication_slots: 5
        checkpoint_timeout: 30

  initdb:
  - encoding: UTF8

  pg_hba:
  - host all dba all md5
  - host replication repl all md5

  users:
    dba:
      password: secret
      options:
        - createrole
        - createdb
    repl:
      password: secret
      options:
        - replication

postgresql:
  listen: 0.0.0.0:5432
  connect_address: 127.0.0.1:5432
  data_dir: /data/pg-1
  config_dir: /data/pg-1
  bin_dir: /usr/lib/postgresql/9.6/bin
  authentication:
    replication:
      username: repl
      password: secret
    superuser:
      username: dba
      password: secret
  parameters:
    unix_socket_directories: '/tmp'
Here’s an explanation of the fields:
- scope: This is the name of the Patroni-managed cluster, which can be used
in
patronictlto refer to your cluster. All nodes should have the same value for this key. - name: Name of the node, unique within the cluster.
- restapi: Patroni has a REST API, which is started at this address (“listen”). The “connect_address” is the address with which other nodes can connect to this API, so the IP here should be the IP by which this node can be reached from other nodes (typically over a private VLAN).
- etcd: The configuration to connect to the etcd cluster. For a 3-node etcd cluster, use “hosts: ip1:port1, ip2:port, ip3:port3”.
- bootstrap: These values are used when a Patroni cluster is created. The
values under “postgresql.parameters” are actual
postgresql.confconfiguration parameters. Some of the values, likewal_levelandmax_wal_sendersare required for streaming replication to work. - initdb: When bootstrapping the first node of a cluster and the PostgreSQL
data directory does not exist, these parameters will be used to invoke
initdb. - pg_hba: The entries that Patroni will add to the
pg_hba.conffile of the database it creates. See the “users” section below. - users: Patroni creates the list of users specified here. These users (who
should have been given access in
pg_hbaabove) are then used in thepostgresql.authenticationsection below to let Patroni login to the Postgres server. Here, the users “dba” (for admin access by Patroni) and “repl” (for replication access from standby’s) are created. - postgresql: These parameters contain a bunch of information about the
PostgreSQL server (“pg-1”) managed by this Patroni node. The IP in
“connect_address” should be the IP from which other servers can reach this
server (typically over a private VLAN). We’re using 127.0.0.1 here since
everything is on the same node. The bin_dir is what we picked up earlier, and
we’re setting data and config dirs to “/data/pg-1”. For now, this directory
does not exist (“/data” should though). The “authentication” parameters should
refer to the replication and admin users that we created above in the “users”
section. Finally, the “parameters” section again contains
postgresql.confconfiguration parameters that Patroni will pass topg_ctlto start the database.
And here is the second file, “pg-2.yml”:
scope: my-ha-cluster
name: pg-2

restapi:
  listen: 0.0.0.0:8009
  connect_address: 127.0.0.1:8009

etcd:
  host: 127.0.0.1:2379

bootstrap:
  dcs:
    ttl: 30
    loop_wait: 10
    retry_timeout: 10
    maximum_lag_on_failover: 1048576
    postgresql:
      use_pg_rewind: true
      use_slots: true
      parameters:
        wal_level: replica
        hot_standby: "on"
        wal_keep_segments: 8
        max_wal_senders: 5
        max_replication_slots: 5
        checkpoint_timeout: 30

  initdb:
  - encoding: UTF8

  pg_hba:
  - host all dba all md5
  - host replication repl all md5

  users:
    dba:
      password: secret
      options:
        - createrole
        - createdb
    repl:
      password: secret
      options:
        - replication

postgresql:
  listen: 0.0.0.0:5433
  connect_address: 127.0.0.1:5433
  data_dir: /data/pg-2
  config_dir: /data/pg-2
  bin_dir: /usr/lib/postgresql/9.6/bin
  authentication:
    replication:
      username: repl
      password: secret
    superuser:
      username: dba
      password: secret
  parameters:
    unix_socket_directories: '/tmp'
    port: 5433
It looks, and is, mostly similar to the first file. There are only a few changes:
- name: This has to be different, and this one we’re naming as “pg-2”.
- restapi: The ports are different, since we’re running 2 Patroni’s on the same node. This is typically not the case.
- postgresql: The ports have been changed from 5432 to 5433. The data directory is also now “/data/pg-2”. In the “parameters” section also, the port is specified as 5433.
These configuration files have more options, you can read more about them here. We’re only using a minimal set to bring up a working cluster.
Starting the Cluster
Note that we don’t have any actual databases yet. We’re going to let Patroni
invoke initdb for us, using the parameters from the configuration files.
We already have etcd running. Let’s also make sure any default PostgreSQL
service is stopped first:
sudo systemctl stop postgresqlNow we can start the first node, by calling the “patroni” script with the path to the first configuration file:
$ patroni pg-1.yml
2018-03-13 07:47:05,853 INFO: Failed to import patroni.dcs.consul
2018-03-13 07:47:05,867 INFO: Selected new etcd server http://127.0.0.1:2379
2018-03-13 07:47:05,878 INFO: Lock owner: None; I am pg-1
2018-03-13 07:47:05,882 INFO: trying to bootstrap a new cluster
The files belonging to this database system will be owned by user "vagrant".
This user must also own the server process.

The database cluster will be initialized with locale "en_US.UTF-8".
The default text search configuration will be set to "english".

Data page checksums are disabled.

creating directory /data/pg-1 ... ok
creating subdirectories ... ok
selecting default max_connections ... 100
selecting default shared_buffers ... 128MB
selecting dynamic shared memory implementation ... posix
creating configuration files ... ok
running bootstrap script ... ok
performing post-bootstrap initialization ... ok
syncing data to disk ... ok

WARNING: enabling "trust" authentication for local connections
You can change this by editing pg_hba.conf or using the option -A, or
--auth-local and --auth-host, the next time you run initdb.

Success. You can now start the database server using:

    /usr/lib/postgresql/9.6/bin/pg_ctl -D /data/pg-1 -l logfile start

2018-03-13 07:47:08,850 INFO: postmaster pid=1658
localhost:5432 - no response
LOG:  database system was shut down at 2018-03-13 07:47:08 GMT
LOG:  MultiXact member wraparound protections are now enabled
LOG:  autovacuum launcher started
LOG:  database system is ready to accept connections
localhost:5432 - accepting connections
localhost:5432 - accepting connections
2018-03-13 07:47:09,916 INFO: establishing a new patroni connection to the postgres cluster
2018-03-13 07:47:09,926 INFO: running post_bootstrap
2018-03-13 07:47:09,940 WARNING: Could not activate Linux watchdog device: "Can't open watchdog device: [Errno 2] No such file or directory: '/dev/watchdog'"
2018-03-13 07:47:09,948 INFO: initialized a new cluster
2018-03-13 07:47:19,943 INFO: Lock owner: pg-1; I am pg-1
2018-03-13 07:47:19,951 INFO: Lock owner: pg-1; I am pg-1
2018-03-13 07:47:19,960 INFO: no action.  i am the leader with the lock
2018-03-13 07:47:29,992 INFO: Lock owner: pg-1; I am pg-1
2018-03-13 07:47:30,000 INFO: no action.  i am the leader with the lock
As you can see, it has invoked initdb to create a new database at /data/pg-1,
and started the server. You can connect to the server using psql -h /tmp -U dba
postgres at this point.
Now let’s bring up the standby, by running “patroni” with the second configuration file, in another terminal:
$ patroni pg-2.yml
2018-03-13 07:58:55,411 INFO: Failed to import patroni.dcs.consul
2018-03-13 07:58:55,425 INFO: Selected new etcd server http://127.0.0.1:2379
2018-03-13 07:58:55,438 INFO: Lock owner: pg-1; I am pg-2
2018-03-13 07:58:55,441 INFO: trying to bootstrap from leader 'pg-1'
2018-03-13 07:58:55,962 INFO: replica has been created using basebackup
2018-03-13 07:58:55,963 INFO: bootstrapped from leader 'pg-1'
2018-03-13 07:58:55,999 INFO: postmaster pid=1752
localhost:5433 - no response
LOG:  database system was interrupted; last known up at 2018-03-13 07:58:55 GMT
LOG:  entering standby mode
LOG:  redo starts at 0/2000028
LOG:  consistent recovery state reached at 0/20000F8
LOG:  database system is ready to accept read only connections
FATAL:  could not start WAL streaming: ERROR:  replication slot "pg_2" does not exist

FATAL:  could not start WAL streaming: ERROR:  replication slot "pg_2" does not exist

localhost:5433 - accepting connections
localhost:5433 - accepting connections
2018-03-13 07:58:57,075 INFO: Lock owner: pg-1; I am pg-2
2018-03-13 07:58:57,075 INFO: does not have lock
2018-03-13 07:58:57,075 INFO: establishing a new patroni connection to the postgres cluster
2018-03-13 07:58:57,090 INFO: no action.  i am a secondary and i am following a leader
2018-03-13 07:58:59,958 INFO: Lock owner: pg-1; I am pg-2
2018-03-13 07:58:59,958 INFO: does not have lock
2018-03-13 07:58:59,962 INFO: no action.  i am a secondary and i am following a leader
LOG:  started streaming WAL from primary at 0/3000000 on timeline 1
Patroni has taken a backup using pg_basebackup, setup streaming replication
and brought up the PostgreSQL server. To verify, you can try connecting to the
standby with psql -h /tmp -p 5433 -U dba postgres. We’d specified “hot_standby”
as “on”, so read-only connections to the standby are possible.
Using Patronictl
Patroni includes a command called “patronictl” which can be used to control the cluster. Let’s check the status of the cluster:
$ patronictl -d etcd://127.0.0.1:2379 list my-ha-cluster
+---------------+--------+-----------+--------+---------+-----------+
|    Cluster    | Member |    Host   |  Role  |  State  | Lag in MB |
+---------------+--------+-----------+--------+---------+-----------+
| my-ha-cluster |  pg-1  | 127.0.0.1 | Leader | running |       0.0 |
| my-ha-cluster |  pg-2  | 127.0.0.1 |        | running |       0.0 |
+---------------+--------+-----------+--------+---------+-----------+
Manual Failover
The patronictl command can be used to do a manual failover. Since pg-1 is the
current master, we want to promote pg-2. Let’s do that with:
$ patronictl -d etcd://127.0.0.1:2379 failover my-ha-cluster
Candidate ['pg-2'] []: pg-2
Current cluster topology
+---------------+--------+-----------+--------+---------+-----------+
|    Cluster    | Member |    Host   |  Role  |  State  | Lag in MB |
+---------------+--------+-----------+--------+---------+-----------+
| my-ha-cluster |  pg-1  | 127.0.0.1 | Leader | running |       0.0 |
| my-ha-cluster |  pg-2  | 127.0.0.1 |        | running |       0.0 |
+---------------+--------+-----------+--------+---------+-----------+
Are you sure you want to failover cluster my-ha-cluster, demoting current master pg-1? [y/N]: y
2018-03-13 08:06:27.49165 Successfully failed over to "pg-2"
+---------------+--------+-----------+--------+---------+-----------+
|    Cluster    | Member |    Host   |  Role  |  State  | Lag in MB |
+---------------+--------+-----------+--------+---------+-----------+
| my-ha-cluster |  pg-1  | 127.0.0.1 |        | stopped |   unknown |
| my-ha-cluster |  pg-2  | 127.0.0.1 | Leader | running |           |
+---------------+--------+-----------+--------+---------+-----------+
Looks like the failover happened. Let’s list the nodes again to confirm:
$ patronictl -d etcd://127.0.0.1:2379 list my-ha-cluster
+---------------+--------+-----------+--------+---------+-----------+
|    Cluster    | Member |    Host   |  Role  |  State  | Lag in MB |
+---------------+--------+-----------+--------+---------+-----------+
| my-ha-cluster |  pg-1  | 127.0.0.1 |        | running |       0.0 |
| my-ha-cluster |  pg-2  | 127.0.0.1 | Leader | running |       0.0 |
+---------------+--------+-----------+--------+---------+-----------+
The node pg-2 has now indeed become the master. The Patroni output for pg-2
should contain log lines like:
2018-03-13 08:09:07,939 INFO: Lock owner: pg-2; I am pg-2
2018-03-13 08:09:07,952 INFO: no action.  i am the leader with the lock
Automatic Failover
When the current leader, pg-2, goes off the network, becomes unreachable, or
if the node crashes, then the Patroni at pg-1 should take over and promote
pg-1. Let’s see if that happens by killing the pg-2 Patroni process with a
^C:
2018-03-13 08:18:12,469 INFO: Lock owner: pg-2; I am pg-2
2018-03-13 08:18:12,477 INFO: no action.  i am the leader with the lock
^CLOG:  received fast shutdown request
LOG:  aborting any active transactions
FATAL:  terminating connection due to administrator command
LOG:  autovacuum launcher shutting down
LOG:  shutting down
LOG:  database system is shut down
2018-03-13 08:18:17,008 INFO: Lock owner: pg-2; I am pg-2
$
Over in pg-1’s terminal, we can see it promoting itself:
2018-03-13 08:18:12,476 INFO: Lock owner: pg-2; I am pg-1
2018-03-13 08:18:12,476 INFO: does not have lock
2018-03-13 08:18:12,479 INFO: no action.  i am a secondary and i am following a leader
LOG:  replication terminated by primary server
DETAIL:  End of WAL reached on timeline 4 at 0/5000838.
FATAL:  could not send end-of-streaming message to primary: no COPY in progress

LOG:  invalid record length at 0/5000838: wanted 24, got 0
FATAL:  could not connect to the primary server: could not connect to server: Connection refused
                Is the server running on host "127.0.0.1" and accepting
                TCP/IP connections on port 5433?

2018-03-13 08:18:17,030 WARNING: request failed: GET http://127.0.0.1:8009/patroni (('Connection aborted.', error(104, 'Connection reset by peer')))
2018-03-13 08:18:17,162 INFO: promoted self to leader by acquiring session lock
server promoting
LOG:  received promote request
LOG:  redo done at 0/50007C8
2018-03-13 08:18:17,173 INFO: cleared rewind state after becoming the leader
LOG:  selected new timeline ID: 5
LOG:  archive recovery complete
LOG:  MultiXact member wraparound protections are now enabled
LOG:  database system is ready to accept connections
LOG:  autovacuum launcher started
2018-03-13 08:18:18,449 INFO: Lock owner: pg-1; I am pg-1
2018-03-13 08:18:18,469 INFO: no action.  i am the leader with the lock
and the node status confirms it:
$ patronictl -d etcd://localhost:2379 list my-ha-cluster
+---------------+--------+-----------+--------+---------+-----------+
|    Cluster    | Member |    Host   |  Role  |  State  | Lag in MB |
+---------------+--------+-----------+--------+---------+-----------+
| my-ha-cluster |  pg-1  | 127.0.0.1 | Leader | running |       0.0 |
+---------------+--------+-----------+--------+---------+-----------+
Onward!
The aim of this post was to get you up and running with a Patroni cluster on which you can start experimenting. Patroni can do much more than what we just did with it.
You can read more about Patroni in the docs, or go through the source here. The original Compose article here also has some information about how the solution works.
Monitoring PostgreSQL With OpsDash
With our own product, OpsDash, you can quickly start monitoring your PostgreSQL servers, and get instant insight into key performance and health metrics including replication stats.
Here’s a default, pre-configured dashboard for PostgreSQL.
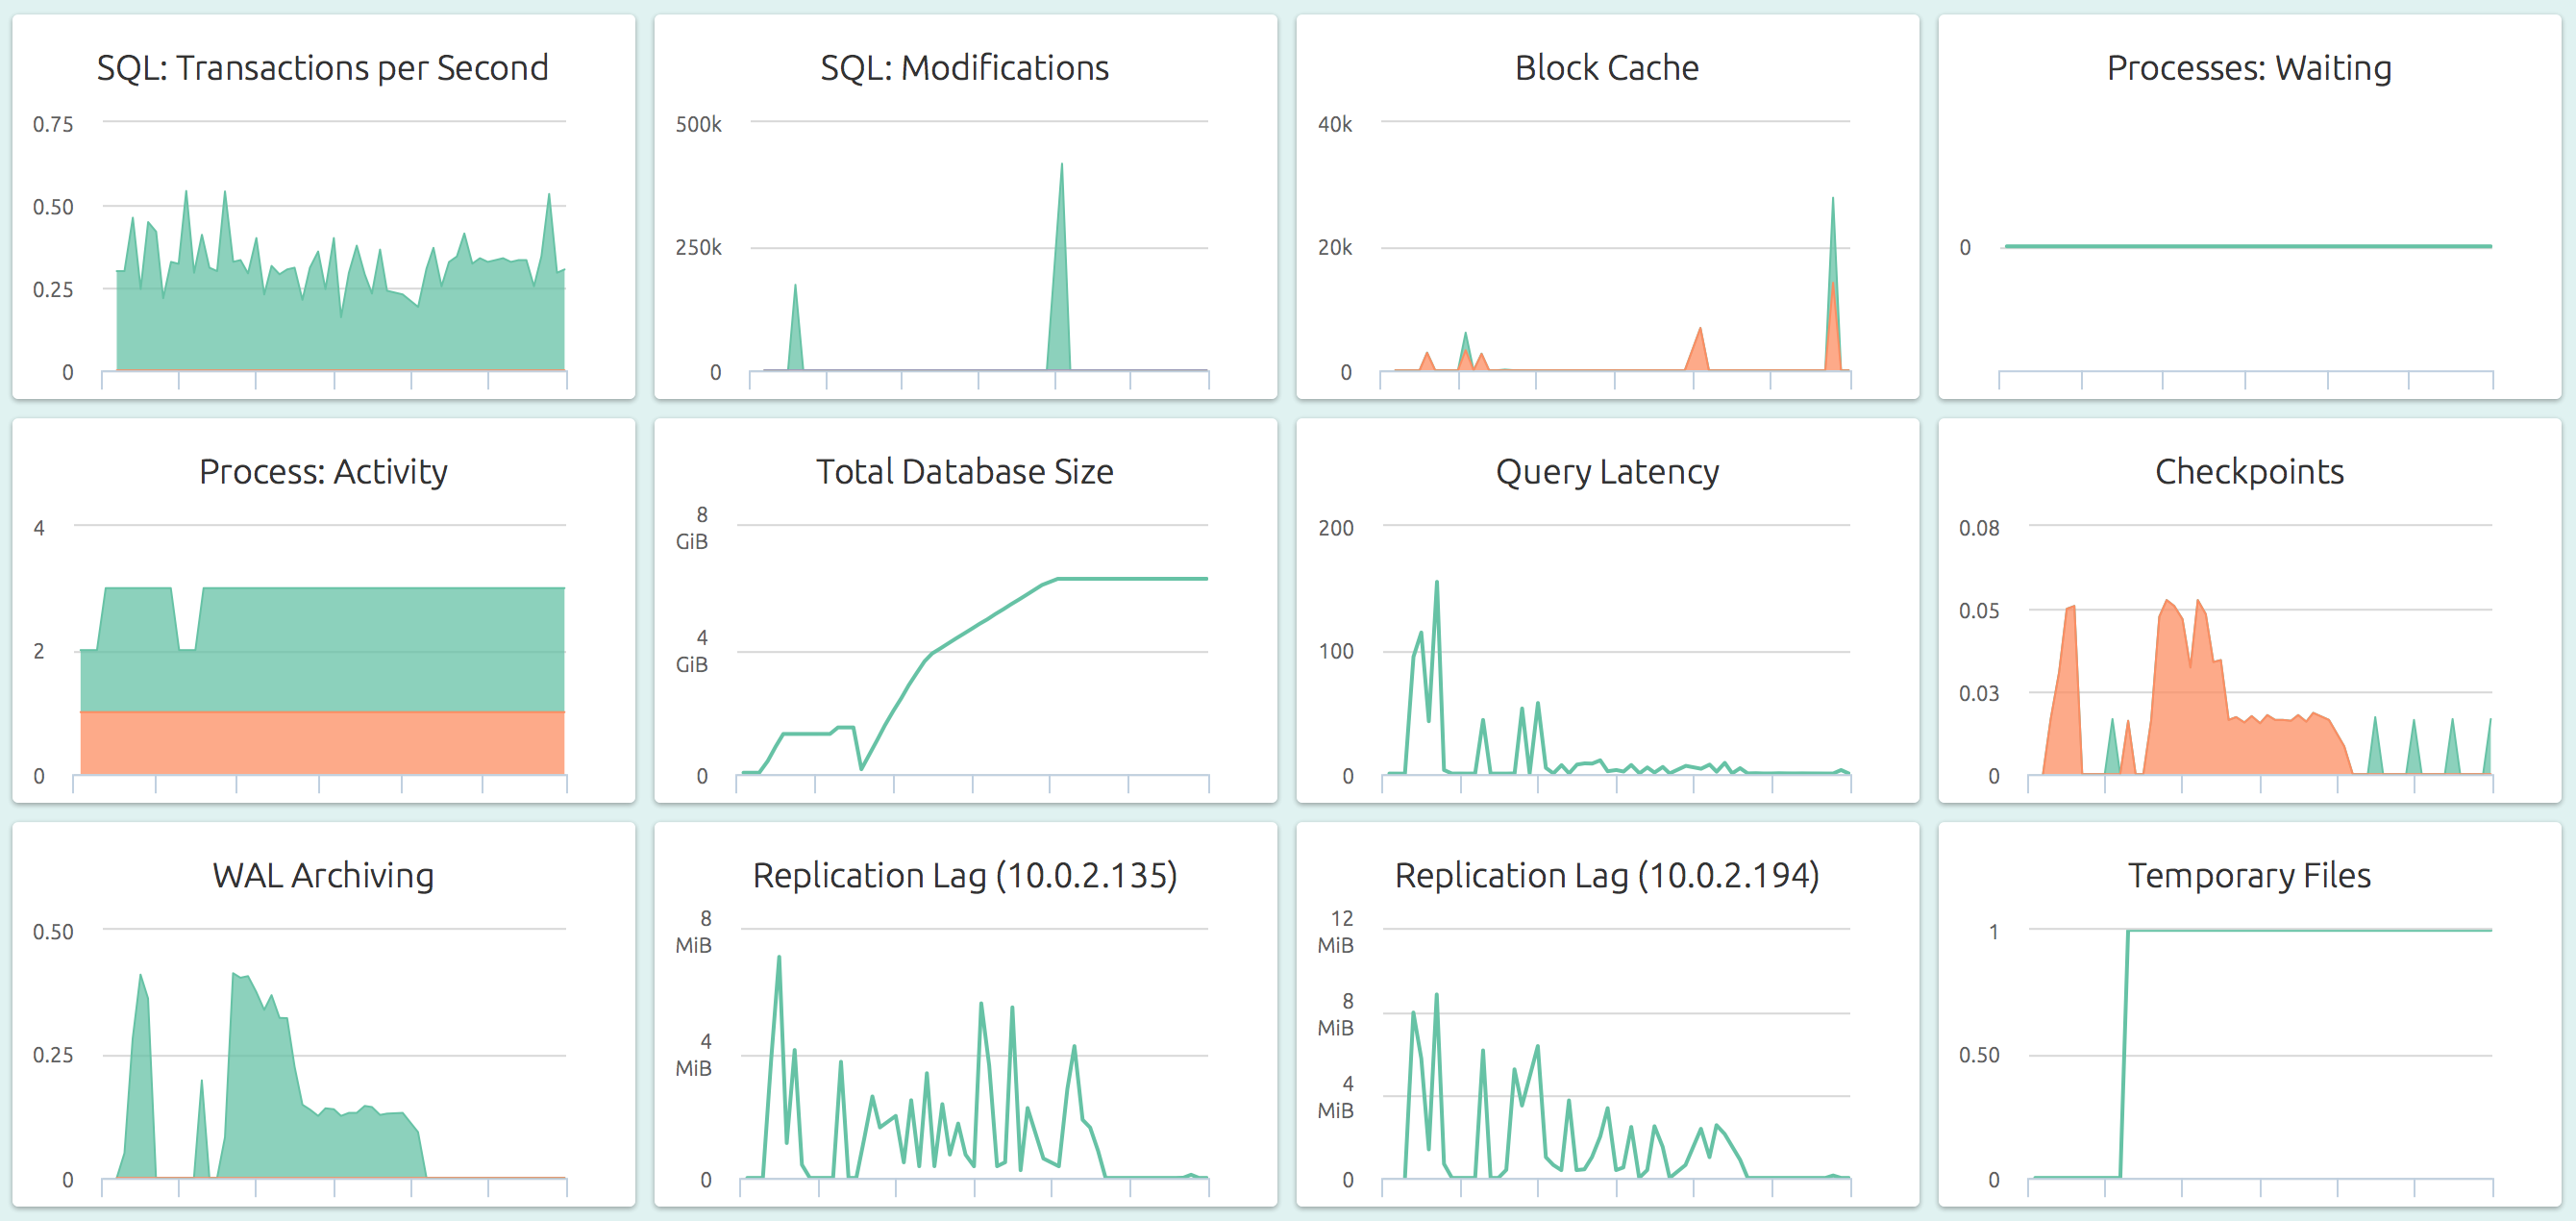
OpsDash strives to save you the tedious work of setting up a useful dashboard. The metrics you see here were carefully chosen to represent the most relevant health and performance indicators for a typical PostgreSQL instance.
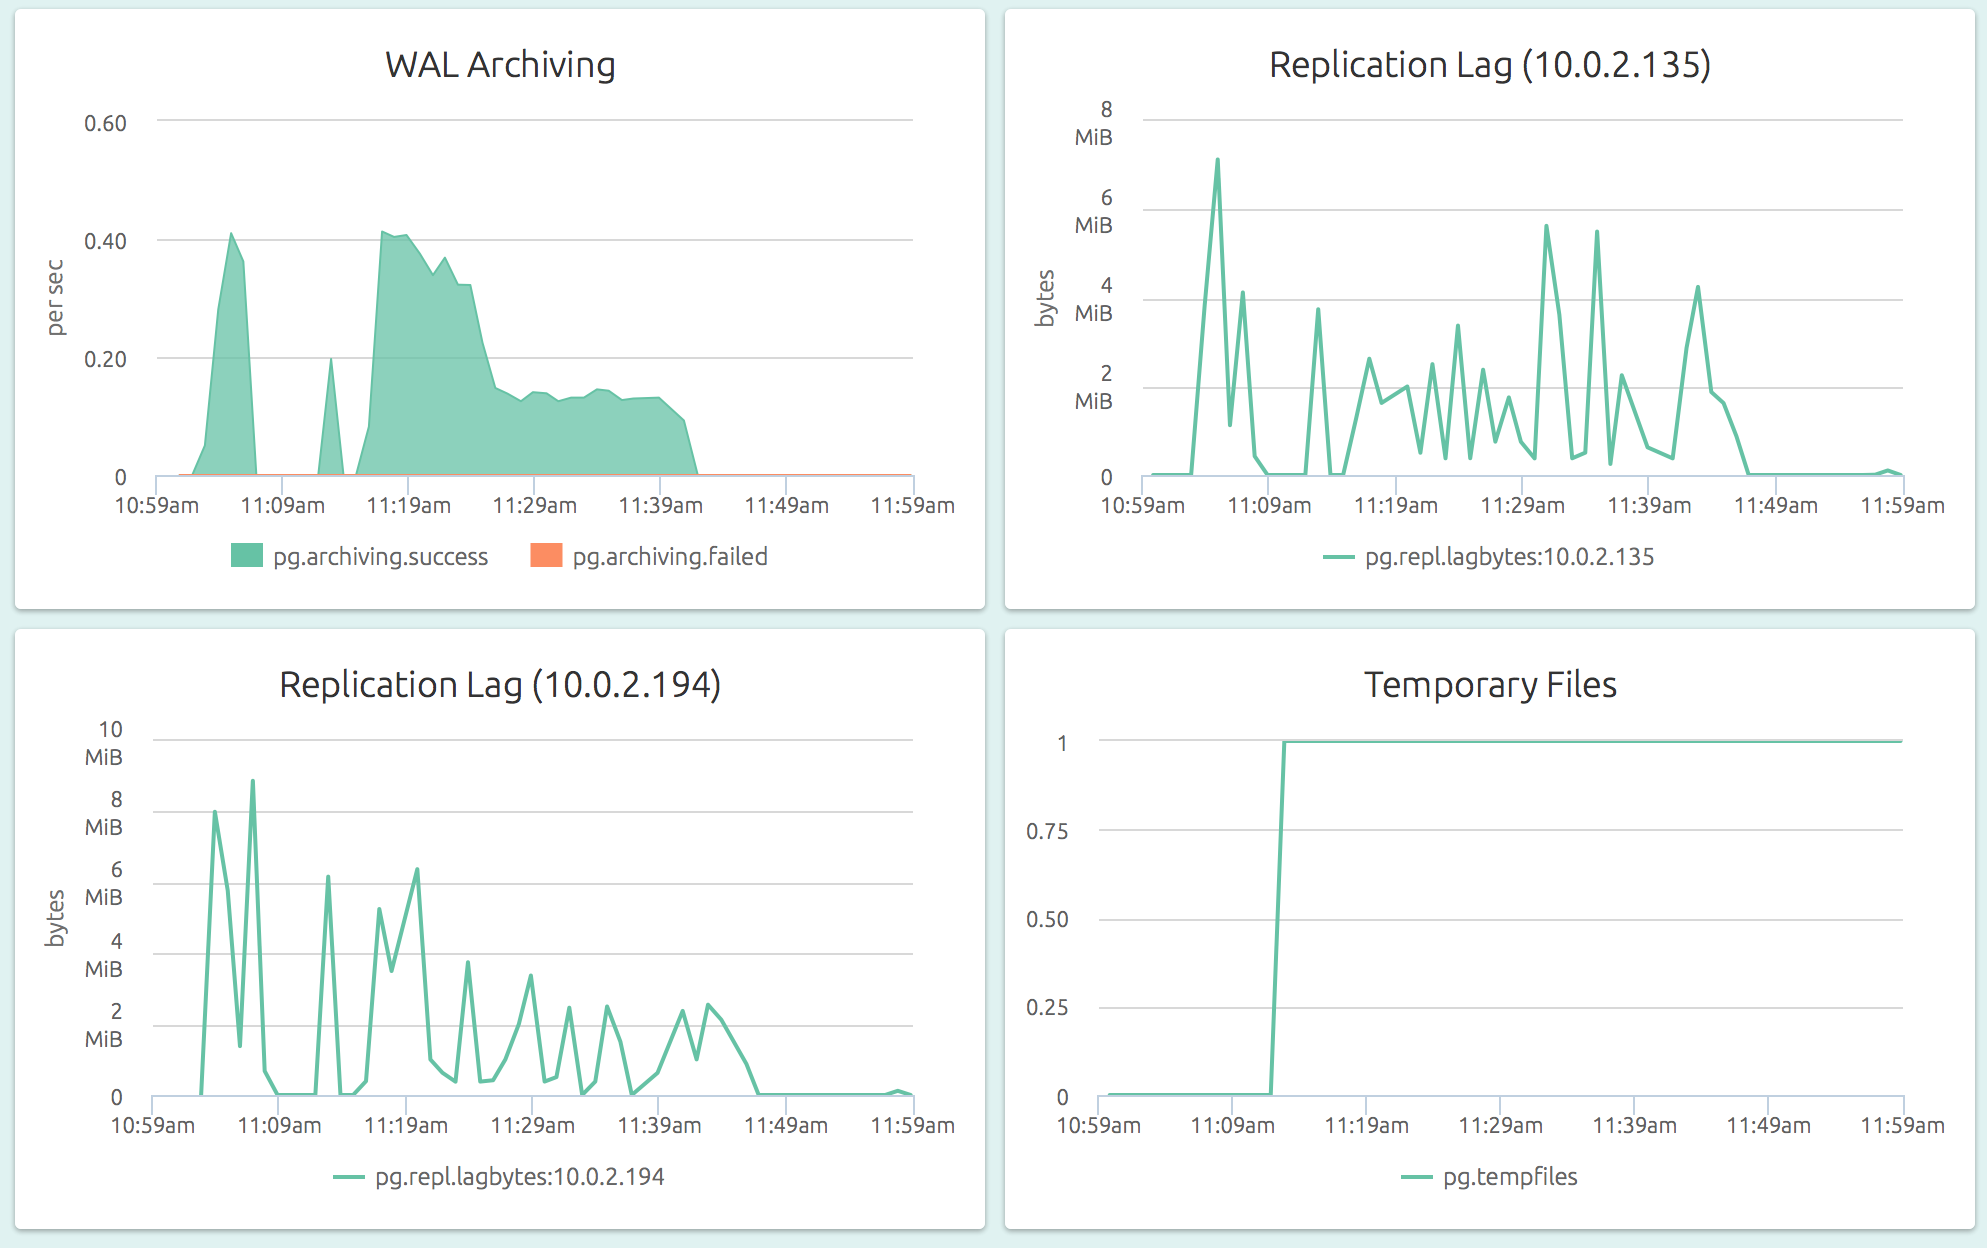
OpsDash understands the streaming replication feature of PostgreSQL and displays per-slave replication status on the master:
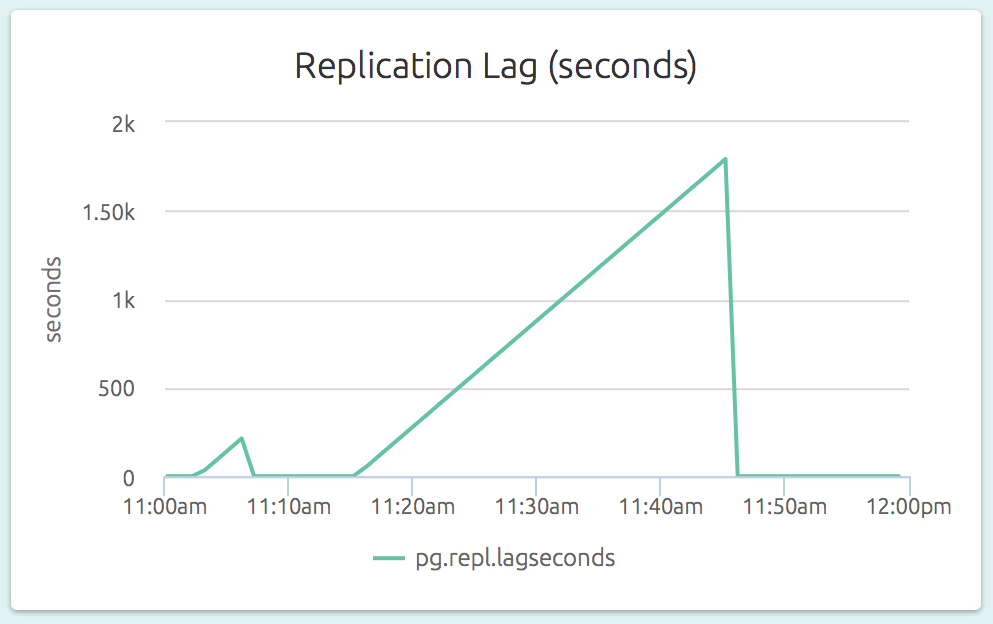
The replication lag (as a length of time) is also visible on a slave’s dashboard. In the graph below (part of the dashboard of a slave), we can see that the slave could not catch up to the master’s changes for a while.
Sign up for a free 14-day trial of OpsDash SaaS today!