PostgreSQL 9.4 and later come with a feature called “replication slots”. They can be used to make WAL archiving and streaming replication more robust and efficient. Read on to learn more, with hands-on examples.
WAL Files
PostgreSQL provides ACID semantics for your data by sequencing transactions into a long series of changes, like an ever-growing changelog. Descriptions of these changes are encoded into “WAL files” – a series of ordered 16MB binary files stored alongside other files inside the server’s data directory.
This means that if you keep around all the WAL files since the creation of the database, you can recreate that database by reading and replaying the changes from the WAL files. This is the basis for streaming replication, WAL archiving and Point-In-Time-Recovery (PITR) in PostgreSQL.
(Note: some objects, like unlogged tables and hash indexes are not captured in WAL files – but that does not compromise the integrity of the data.)
WAL stands for Write Ahead Log, by the way.
Archiving WAL Files
Copying out WAL files as they are generated, into a “safe” location is called WAL archiving. A “safe” location is typically an NFS-mounted disk, file servers, S3 bucket etc.
Traditionally, a user-supplied script is invoked by PostgreSQL each time a WAL file is generated. The script then copies (using rsync, scp or the like) the file to one or more safe locations.
The WAL files stored in the safe location becomes a form of incremental backup from which a database can be recovered up to any specified point in time.
Log Shipping
Instead of copying the WAL files to a safe location, it can instead be copied to another machine where another PostgreSQL server is running. This server can be configured to be in “recovery mode”, meaning all it does is to apply any new WAL files that it gets. This second server then, becomes a “standby” – it will be an identical, warm backup of the “primary” PostgreSQL server.
(The standby can also be made a “hot standby”, where it can also serve read-only queries, thus being a “read replica”.)
The process of “shipping” WAL files (rather than “archiving” them) to one ore more standby servers is called “log shipping”. Typically, log shipping is also done using the same archive script as before – it copies newly-created WAL files at the primary over the network to the standby servers.
Streaming Replication
Streaming replication was added to PostgreSQL inorder to improve the log shipping process. With streaming replication, the standby server will connect to the primary server over the network (using a different protocol than the standard client protocol). The primary server can then send WAL file contents directly over this connection without having to rely on user-supplied scripts.
This also allows for better tracking. You can know for example, how far the standby has caught up with the primary in terms of receiving, applying and replaying the changes from the primary.
Streaming replication can be, and is popularly, used to maintain a failover-ready standby that can be promoted to the primary in case the primary fails.
WAL File Retention
Which brings us to the topic of how long the primary should retain WAL files.
Typically, you’ll have a WAL archival script that will copy WAL files to one or more long-term archive locations. If you don’t have any standbys or other streaming replication clients, then basically the server can discard the WAL file once the archive script reports success. You’ll still need some recent WAL files for crash recovery (data from recent WAL files get replayed during crash recovery).
(BTW: PostgreSQL does not actually discard the file, it renames and recycles them.)
If you have standbys though, there is a problem – you need to keep around WAL files long enough for as long as your slowest standby needs them. If the standby that was taken down for a while comes back online and asks the primary for a WAL file that the primary no longer has, then the replication fails.
The logical solution is to make the primary to keep track of how far behind the standby is, and to not delete WAL files that any standbys still need. And this feature is called replication slots.
Replication Slots
(Note: there are “physical” and “logical” replication slots. We cover only “physical” replication slots in this article.)
Replication slots are uniquely identified by names. Each slot is associated with:
- the oldest WAL required by the consumer of the slot - WAL files later than this are not deleted during checkpoints
- the oldest transaction ID required to be retained by the consumer of the slot - rows needed by any transactions later than this are not deleted by vacuum
Let’s try it out. First, we need a new database to experiment with:
# create a new database under the directory "data"
pg_ctl initdb -D data
Make sure that data/pg_hba.conf allows normal and replication connections:
host all         all all trust
host replication all all trust
(This is about as insecure as you can get, but works great for experimenting!) Let’s start the server now:
# start our very insecure server, send logs to file called "log"
pg_ctl start -D data -l log
Creating a Replication Slot
Now that we have a running PostgreSQL server, let’s create a replication slot.
We can do this using the pg_create_physical_replication_slot function.
$ psql postgres
psql (10.2)
Type "help" for help.

postgres=# select pg_create_physical_replication_slot('slot1');
 pg_create_physical_replication_slot
-------------------------------------
 (slot1,)
(1 row)
Let’s also run pgbench for some traffic. Make a database first:
postgres=# create database bench;
CREATE DATABASE
Then initialize and run pgbench:
$ pgbench -i -s 10 bench
NOTICE:  table "pgbench_history" does not exist, skipping
NOTICE:  table "pgbench_tellers" does not exist, skipping
NOTICE:  table "pgbench_accounts" does not exist, skipping
NOTICE:  table "pgbench_branches" does not exist, skipping
creating tables...
100000 of 1000000 tuples (10%) done (elapsed 0.08 s, remaining 0.74 s)
200000 of 1000000 tuples (20%) done (elapsed 0.28 s, remaining 1.12 s)
300000 of 1000000 tuples (30%) done (elapsed 0.41 s, remaining 0.95 s)
400000 of 1000000 tuples (40%) done (elapsed 0.59 s, remaining 0.89 s)
500000 of 1000000 tuples (50%) done (elapsed 0.81 s, remaining 0.81 s)
600000 of 1000000 tuples (60%) done (elapsed 0.95 s, remaining 0.63 s)
700000 of 1000000 tuples (70%) done (elapsed 1.12 s, remaining 0.48 s)
800000 of 1000000 tuples (80%) done (elapsed 1.36 s, remaining 0.34 s)
900000 of 1000000 tuples (90%) done (elapsed 1.49 s, remaining 0.17 s)
1000000 of 1000000 tuples (100%) done (elapsed 1.68 s, remaining 0.00 s)
vacuum...
set primary keys...
done.
$ pgbench -T 120 bench
starting vacuum...end.
Now that we have a pgbench busy in the background, we can see that the server is generating WAL files:
$ ls -lFh data/pg_wal
total 177M
-rw------- 1 vagrant vagrant  16M Feb 26 11:03 000000010000000000000001
-rw------- 1 vagrant vagrant  16M Feb 26 11:03 000000010000000000000002
-rw------- 1 vagrant vagrant  16M Feb 26 11:03 000000010000000000000003
-rw------- 1 vagrant vagrant  16M Feb 26 11:03 000000010000000000000004
-rw------- 1 vagrant vagrant  16M Feb 26 11:03 000000010000000000000005
-rw------- 1 vagrant vagrant  16M Feb 26 11:03 000000010000000000000006
-rw------- 1 vagrant vagrant  16M Feb 26 11:03 000000010000000000000007
-rw------- 1 vagrant vagrant  16M Feb 26 11:03 000000010000000000000008
-rw------- 1 vagrant vagrant  16M Feb 26 11:04 000000010000000000000009
-rw------- 1 vagrant vagrant  16M Feb 26 11:05 00000001000000000000000A
-rw------- 1 vagrant vagrant  16M Feb 26 11:05 00000001000000000000000B
drwx------ 2 vagrant vagrant 4.0K Feb 26 11:00 archive_status/
$
Receiving WALs Using a Slot
We can receive these WAL files using the pg_receivewal command (on versions
before 10, this is pg_receivexlog). Let’s run it now, and ask it to use the
“slot1” that we created earlier:
$ mkdir wals
$ pg_receivewal -D wals -S slot1 -v
pg_receivewal: starting log streaming at 0/17000000 (timeline 1)
pg_receivewal: finished segment at 0/18000000 (timeline 1)
pg_receivewal: finished segment at 0/19000000 (timeline 1)
We created a directory called “wals” and asked pg_receivewal to fetch and store
the WALs into this directory. Since this is the first time we’re using the slot,
pg_receivewal starts fetching from the WAL location at the time it was started –
in this case from 0/17000000. When it has fetched 17, 18 completely and is
partway through 19, here is how the “wals” directory looks:
$ l
total 48M
-rw------- 1 vagrant vagrant 16M Feb 26 11:10 000000010000000000000017
-rw------- 1 vagrant vagrant 16M Feb 26 11:11 000000010000000000000018
-rw------- 1 vagrant vagrant 16M Feb 26 11:14 000000010000000000000019.partial
There is a catalog view called pg_replication_slots which gives you
information about these slots:
postgres=# select slot_name,restart_lsn from pg_replication_slots;
 slot_name | restart_lsn
-----------+-------------
 slot1     | 0/19000000
(1 row)
PostgreSQL will not remove WAL files prior to “restart_lsn”, even at the risk of filling up the disk.
Let’s stop pg_receivewal for a while now, and let pgbench do more transactions:
$ pg_receivewal -D wals -S slot1 -v
pg_receivewal: starting log streaming at 0/17000000 (timeline 1)
pg_receivewal: finished segment at 0/18000000 (timeline 1)
pg_receivewal: finished segment at 0/19000000 (timeline 1)
^Cpg_receivewal: received interrupt signal, exiting
pg_receivewal: not renaming "000000010000000000000019.partial", segment is not complete
pg_receivewal: received interrupt signal, exiting
$
More pgbench:
$ pgbench -T 120 bench
starting vacuum...end.
After the pgbench, the current WAL has crept up from 19 to 2B:
postgres=# select pg_current_wal_lsn();
 pg_current_wal_lsn
--------------------
 0/2B0F30A8
(1 row)
while our slot remains at 19. Let’s see what happens when we restart pg_receivewal:
$ pg_receivewal -D wals -S slot1 -v
pg_receivewal: starting log streaming at 0/19000000 (timeline 1)
pg_receivewal: finished segment at 0/1A000000 (timeline 1)
pg_receivewal: finished segment at 0/1B000000 (timeline 1)
pg_receivewal: finished segment at 0/1C000000 (timeline 1)
pg_receivewal: finished segment at 0/1D000000 (timeline 1)
pg_receivewal: finished segment at 0/1E000000 (timeline 1)
pg_receivewal: finished segment at 0/1F000000 (timeline 1)
pg_receivewal: finished segment at 0/20000000 (timeline 1)
pg_receivewal: finished segment at 0/21000000 (timeline 1)
pg_receivewal: finished segment at 0/22000000 (timeline 1)
pg_receivewal: finished segment at 0/23000000 (timeline 1)
pg_receivewal: finished segment at 0/24000000 (timeline 1)
pg_receivewal: finished segment at 0/25000000 (timeline 1)
pg_receivewal: finished segment at 0/26000000 (timeline 1)
pg_receivewal: finished segment at 0/27000000 (timeline 1)
pg_receivewal: finished segment at 0/28000000 (timeline 1)
pg_receivewal: finished segment at 0/29000000 (timeline 1)
pg_receivewal: finished segment at 0/2A000000 (timeline 1)
pg_receivewal: finished segment at 0/2B000000 (timeline 1)
The server had been saving up WAL files from 19 onwards for slot1’s sake, which
it serves up immediately on the consumer’s startup, and the consumer then
continues to wait for more. The server’s WAL directory (data/pg_wal in v10,
data/pg_xlog in earlier versions) can be checked to verify whether the old
files were retained or deleted as intended.
WAL Archiving with Slots
What we just did was in fact WAL archiving – saving a copy of every WAL generated by the server. We did not use the traditional “archive_command” method, but the set of WAL files that we have are just as good for restoration and PITR.
Streaming Replication with Slots
Let’s try doing streaming replication using slots. First, let’s create another slot:
postgres=# select pg_create_physical_replication_slot('slot2', true);
 pg_create_physical_replication_slot
-------------------------------------
 (slot2,0/30000028)
(1 row)

postgres=# select redo_lsn from pg_control_checkpoint();
  redo_lsn
------------
 0/30000028
(1 row)
We added a “true” parameter to the function this time – this sets the “restart_lsn” of the slot to the current REDO LSN. If we take a “pg_basebackup” at this point, the data files will be guaranteed to contain changes up to REDO LSN. Having the slot’s “restart_lsn” set to this value will guarantee that our new standby, bootstrapped from a pg_basebackup will be able to fetch all changes until it is ready.
Let’s get the backup next. We’ll use the “-S / –slot” parameter to supply the slot name to the pg_basebackup command:
$ pg_basebackup -S slot2 -D data2 -R -v
pg_basebackup: initiating base backup, waiting for checkpoint to complete
pg_basebackup: checkpoint completed
pg_basebackup: write-ahead log start point: 0/32000028 on timeline 1
pg_basebackup: starting background WAL receiver
pg_basebackup: write-ahead log end point: 0/320000F8
pg_basebackup: waiting for background process to finish streaming ...
pg_basebackup: base backup completed
$
Because we created the slot earlier, changes made between the time the slot was created, and the completion of the pg_basebackup command, will be included in the newly created “data2” directory. pg_basebackup informs us that it was written WAL 32 partially, and pg_replication_slots confirms that the restart_lsn has advanced in sync:
postgres=# select slot_name,restart_lsn from pg_replication_slots where slot_name='slot2';
 slot_name | restart_lsn
-----------+-------------
 slot2     | 0/32000000
(1 row)
The recovery.conf for the standby should contain the slot name (we made the pg_basebackup write this using the -R flag):
$ cat data2/recovery.conf
standby_mode = 'on'
primary_conninfo = 'user=vagrant passfile=''/home/vagrant/.pgpass'' port=5432 sslmode=disable sslcompression=1 target_session_attrs=any'
primary_slot_name = 'slot2'
The “primary_slot_name” make the standby use that slot for it’s streaming replication. Let’s start the standby now:
$ pg_ctl start -D data2 -l log2 -o --port=5434
waiting for server to start.... done
server started
$ cat log2
2018-02-28 08:43:18.798 GMT [4489] LOG:  listening on IPv6 address "::1", port 5434
2018-02-28 08:43:18.798 GMT [4489] LOG:  listening on IPv4 address "127.0.0.1", port 5434
2018-02-28 08:43:18.804 GMT [4489] LOG:  listening on Unix socket "/tmp/.s.PGSQL.5434"
2018-02-28 08:43:18.821 GMT [4490] LOG:  database system was interrupted; last known up at 2018-02-28 08:29:50 GMT
2018-02-28 08:43:19.517 GMT [4490] LOG:  entering standby mode
2018-02-28 08:43:19.523 GMT [4490] LOG:  redo starts at 0/32000028
2018-02-28 08:43:19.526 GMT [4490] LOG:  consistent recovery state reached at 0/320000F8
2018-02-28 08:43:19.526 GMT [4489] LOG:  database system is ready to accept read only connections
2018-02-28 08:43:19.539 GMT [4494] LOG:  started streaming WAL from primary at 0/33000000 on timeline 1
$
We hit a checkpoint in between the backup and the start, so the WAL file has crept up to 33.
Examining Replication Status
We now have two active replication slot consumers (pg_receivewal and the standby). We can check the replication status using the pgmetrics tool:
$ pgmetrics -h /tmp --no-password postgres
...snip...
Outgoing Replication Stats:
    Destination #1:
      User:              vagrant
      Application:       pg_receivewal
      Client Address:
      State:             streaming
      Started At:        28 Feb 2018 8:02:36 AM (48 minutes ago)
      Sent LSN:          0/4380C128
      Written Until:     0/4380C128 (no write lag)
      Flushed Until:     0/43000000 (flush lag = 8.0 MiB)
      Replayed Until:
      Sync Priority:     0
      Sync State:        async
    Destination #2:
      User:              vagrant
      Application:       walreceiver
      Client Address:
      State:             streaming
      Started At:        28 Feb 2018 8:43:20 AM (7 minutes ago)
      Sent LSN:          0/4380C128
      Written Until:     0/4380C128 (no write lag)
      Flushed Until:     0/4380C128 (no flush lag)
      Replayed Until:    0/4380C128 (no replay lag)
      Sync Priority:     0
      Sync State:        async

Physical Replication Slots:
    +-------+--------+---------------+-------------+
    |  Name | Active | Oldest Txn ID | Restart LSN |
    +-------+--------+---------------+-------------+
    | slot1 |    yes |               |  0/43000000 |
    | slot2 |    yes |               |  0/4380C128 |
    +-------+--------+---------------+-------------+
...snip...
Where to go from here
Replication in PosgreSQL represents a whole lot of features, knobs and levers accumulated into a stable codebase over more than a decade. Understandably, it takes a lot of reading and experimenting to get to any level of comfort with it.
Read more about replication and standby servers in the docs here.
We didn’t cover temporary physical replication slots, a feature added in v10. pg_basebackup can also make use of such slots by default.
We also didn’t cover logical replication slots or logical decoding.
Monitoring PostgreSQL With OpsDash
With our own product, OpsDash, you can quickly start monitoring your PostgreSQL servers, and get instant insight into key performance and health metrics including replication stats.
Here’s a default, pre-configured dashboard for PostgreSQL.
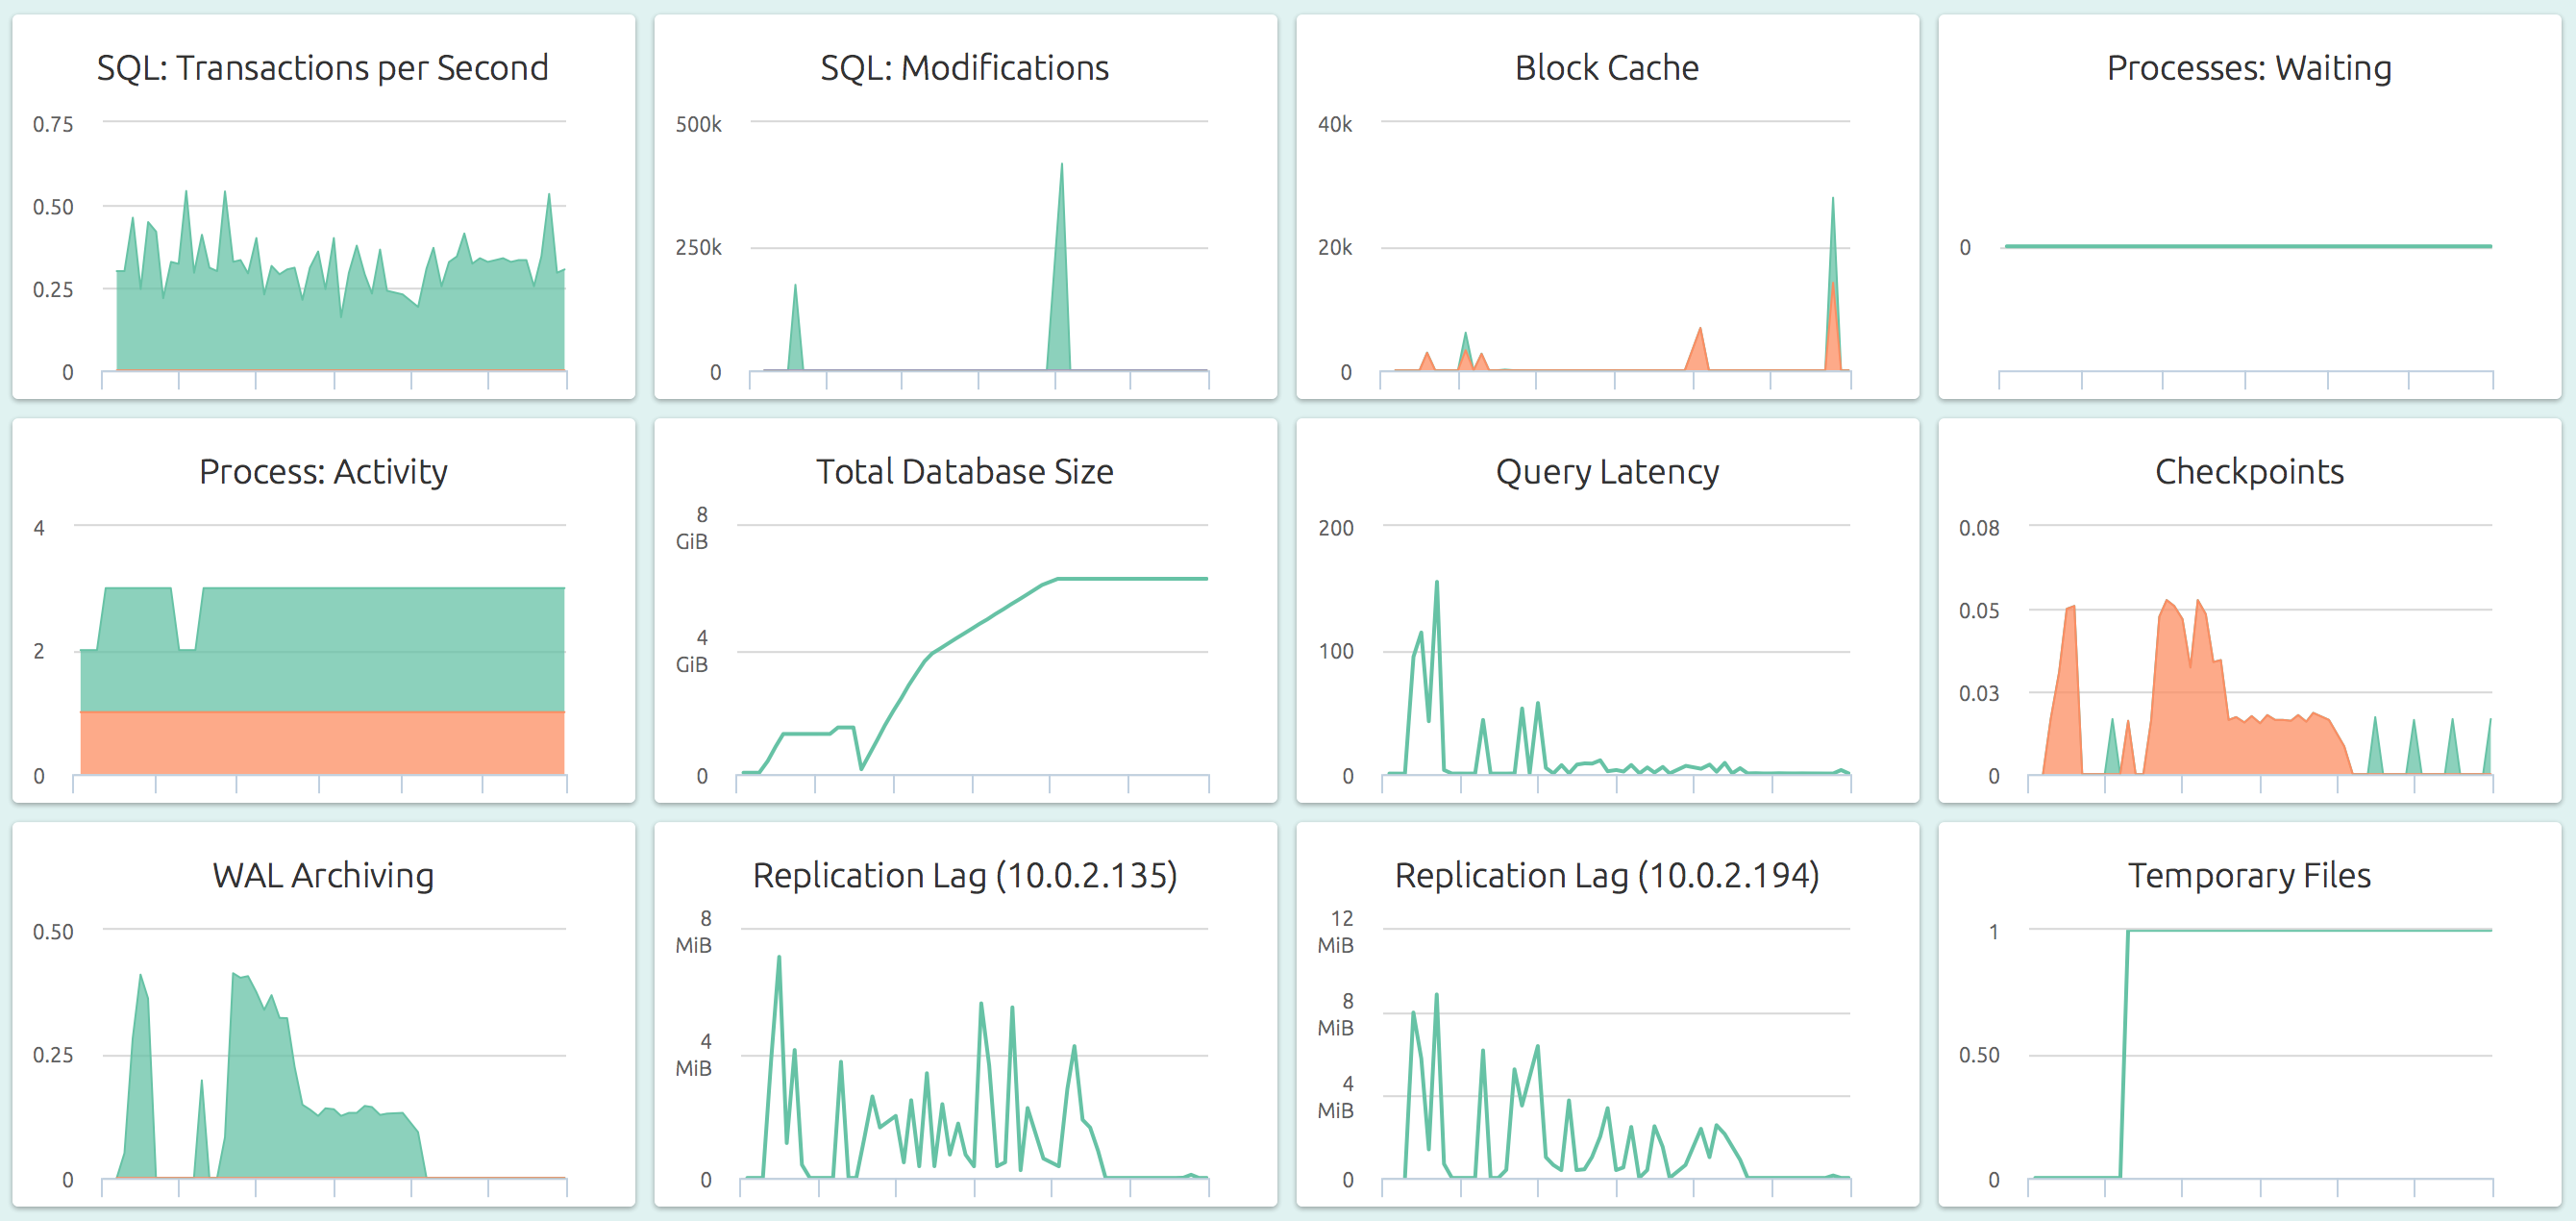
OpsDash strives to save you the tedious work of setting up a useful dashboard. The metrics you see here were carefully chosen to represent the most relevant health and performance indicators for a typical PostgreSQL instance.
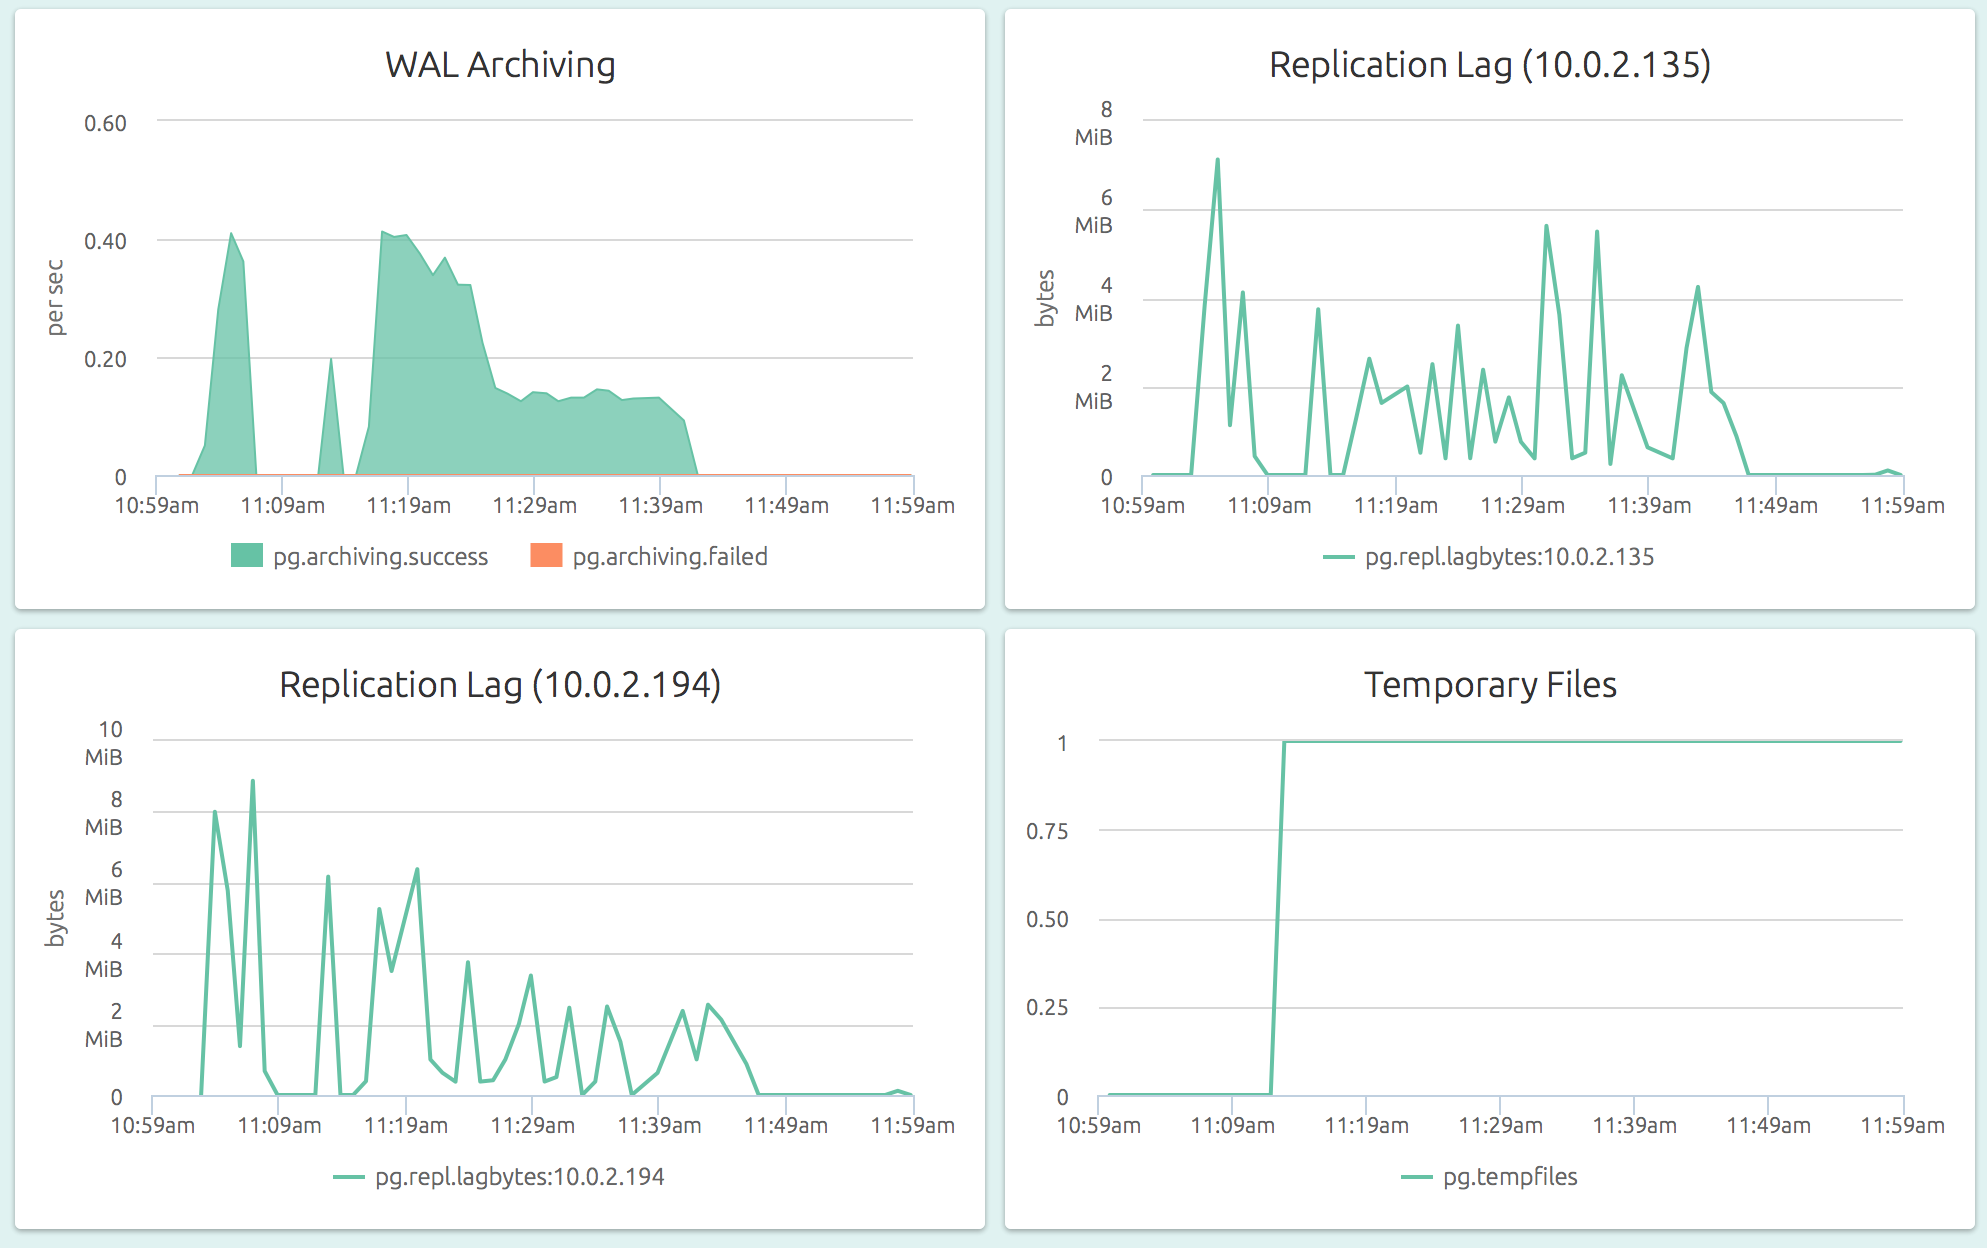
OpsDash understands the streaming replication feature of PostgreSQL and displays per-slave replication status on the master:
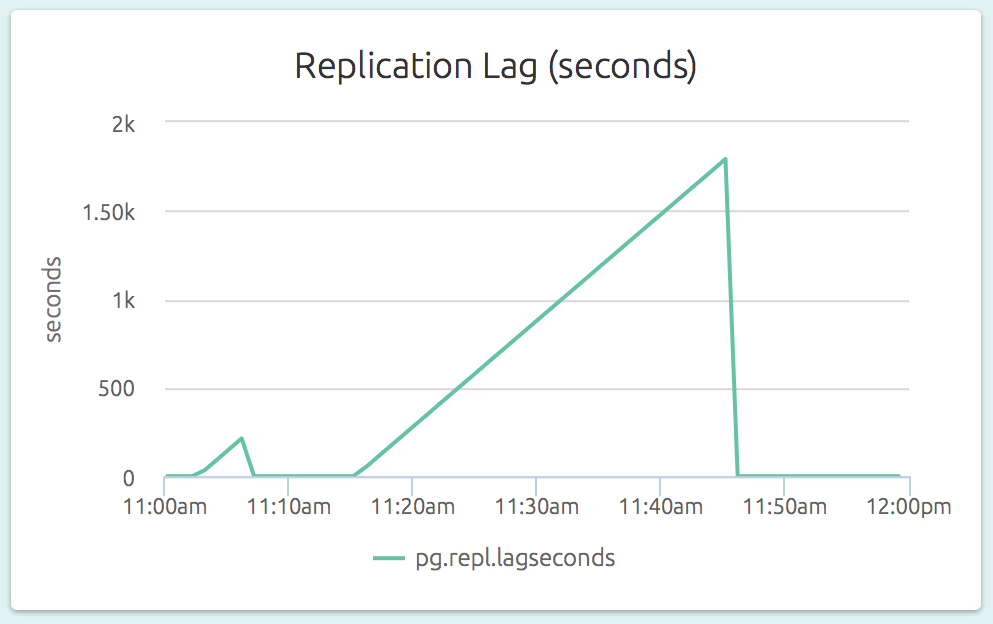
The replication lag (as a length of time) is also visible on a slave’s dashboard. In the graph below (part of the dashboard of a slave), we can see that the slave could not catch up to the master’s changes for a while.
Sign up for a free 14-day trial of OpsDash SaaS today!