Memcache Monitoring
With OpsDash, you can easily monitor caching middleware like memcache for metrics including total items stored and memory usage. You can also monitor clusters of cache nodes and aggregate results across all of them. For example, you can have a single graph that shows the cache hit ratio over a memcache cluster.
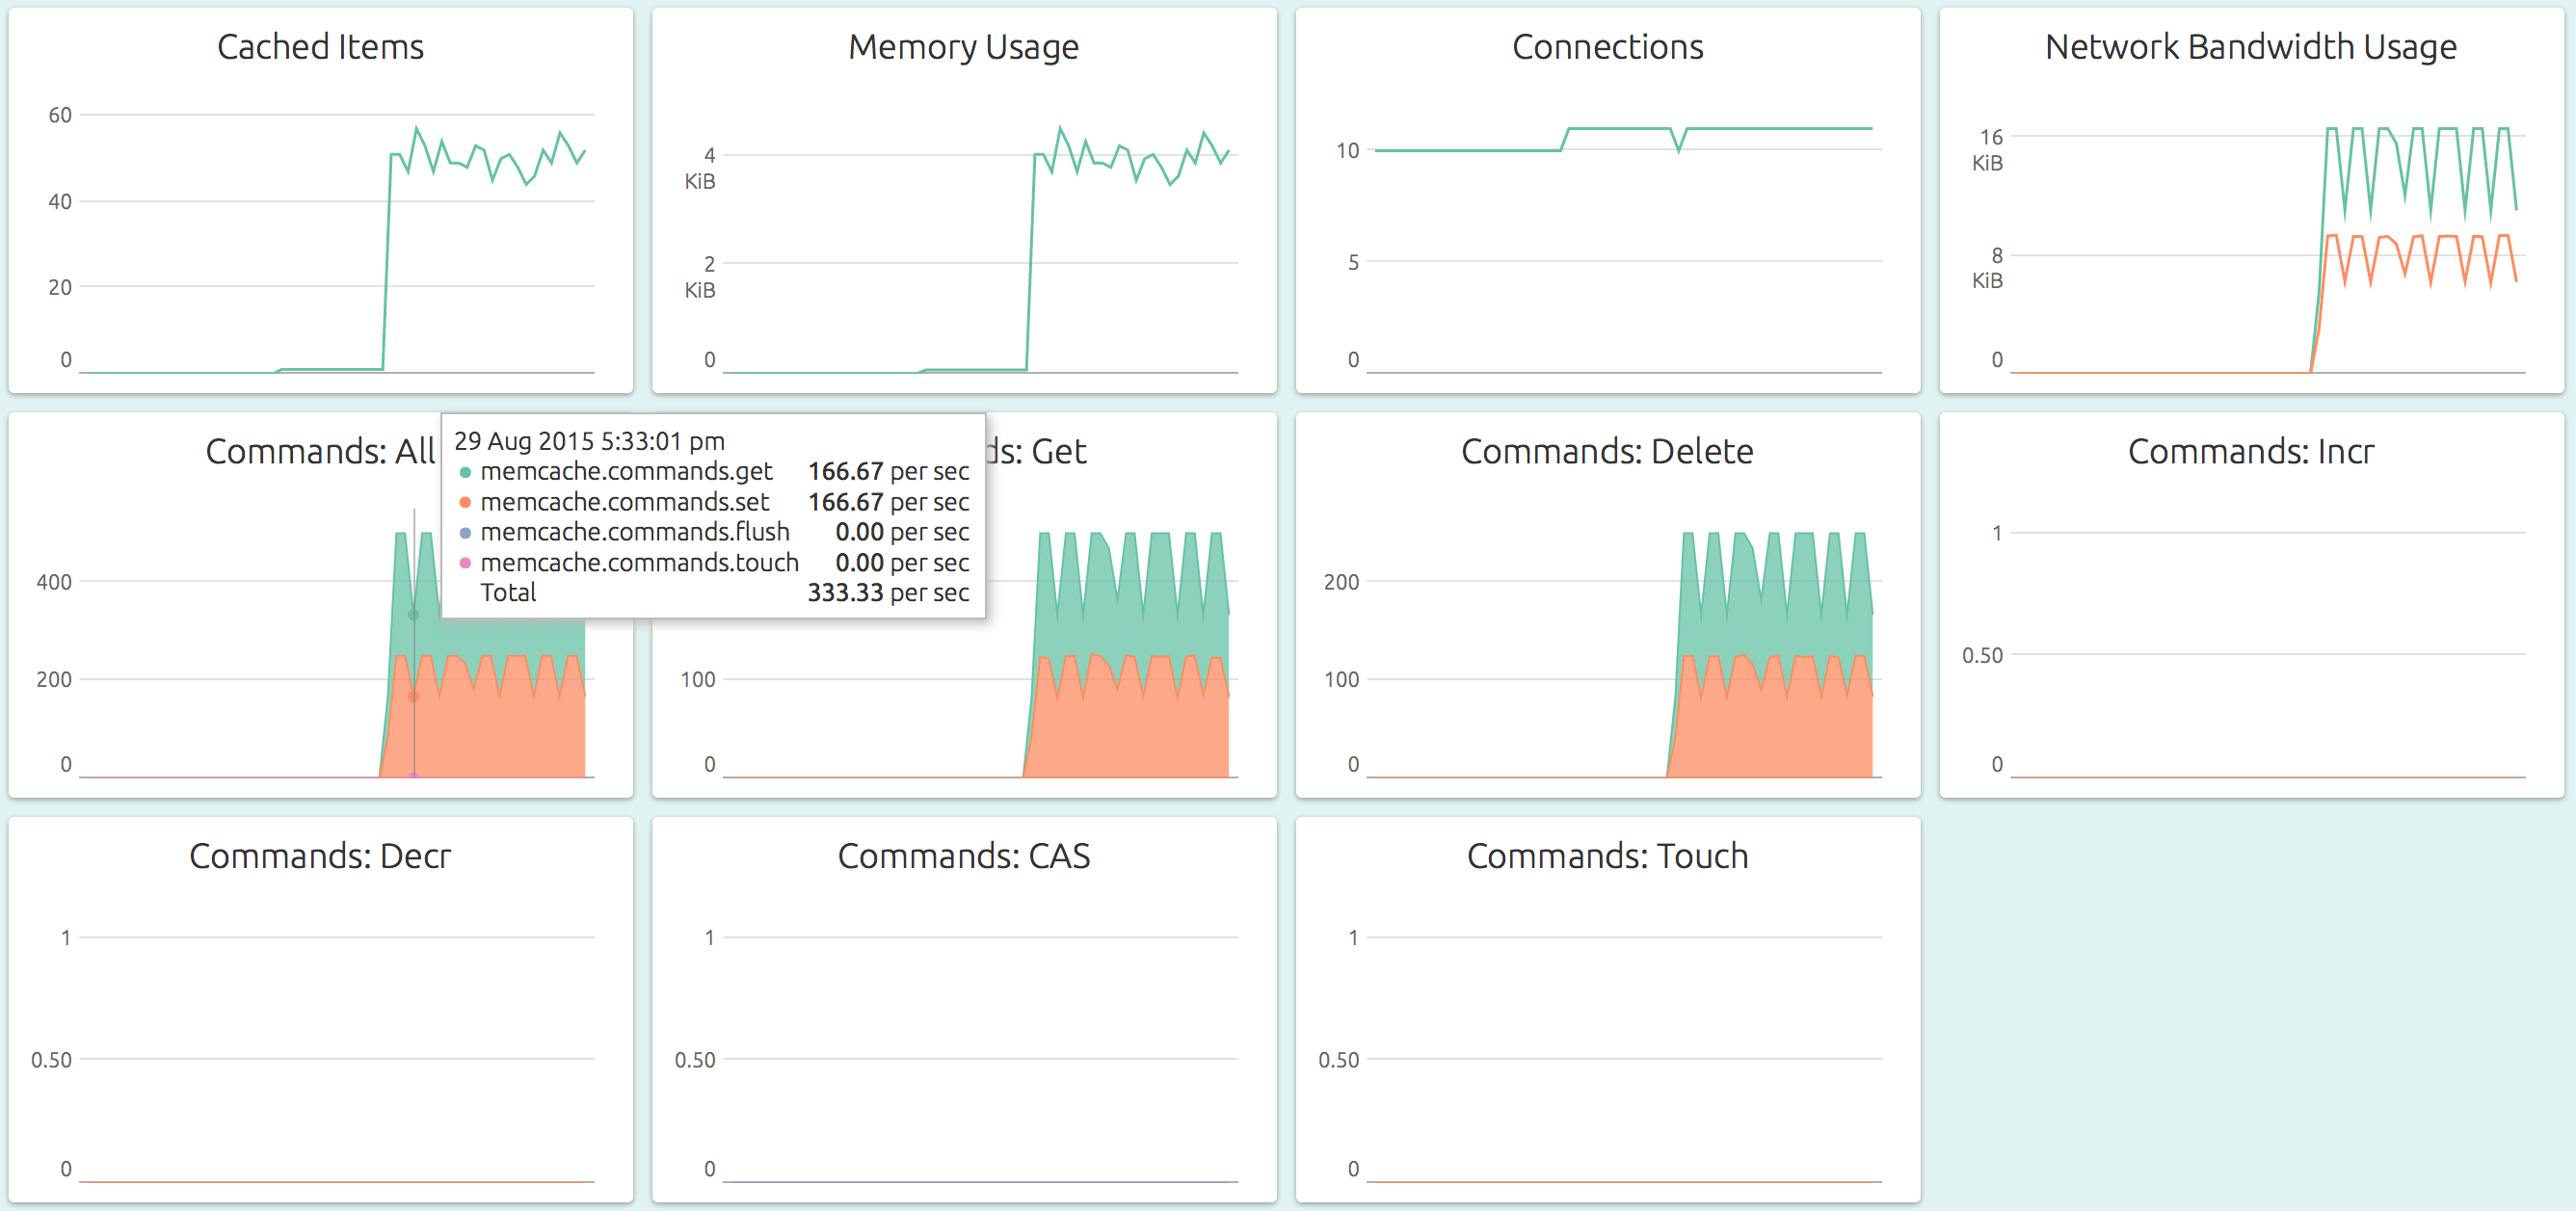
Here’s how OpsDash’s curated dashboards come out of the box:
You can go from 0 to this in just a minute or two! OpsDash strives to save you the tedious work of setting up a useful dashboard. The metrics you see here were carefully chosen to ensure effective memcache monitoring.
This dashboard shows key metrics relevant to the memcache instance’s health and performance:
- Cached Items: The number of items currently resident in memory.
- Memory Usage: The memory used by all the items that are currently resident in memory.
- Connections: The total number of connections that are currently open.
- Network Bandwidth Usage: The data read from and written to the network by memcache, in bytes per second.
- Commands: All: The number of commands executed per second, segregated by the command type: get, set, flush and touch.
- Commands: Get: The number of hits and misses per second for "get" commands.
- Commands: Delete: The number of hits and misses per second for "delete" commands.
- Commands: Incr: The number of hits and misses per second for "incr" commands.
- Commands: Decr: The number of hits and misses per second for "decr" commands.
- Commands: CAS: The number of hits, misses and "bad values" per second for "cas" commands.
- Commands: Touch: The number of hits and misses per second for "touch" commands.
You’ll want to set warning and critical upper limits for these metrics so that you can identify and address emerging issues before they bite. You can quickly setup your alerts in OpsDash and send notifications by Slack, Hipchat, OpsGenie, PagerDuty or Email.
With OpsDash, memcache monitoring is fast and easy. Try it!
Learn More:
New here?
OpsDash is a comprehensive solution for server monitoring, service monitoring, database monitoring and application metrics monitoring. You can use OpsDash for monitoring MySQL, PostgreSQL, MongoDB, memcache, Redis, Apache, Nginx, Elasticsearch and more. It provides intelligent, customizable dashboards and spam-free alerting via email, HipChat, Slack, PagerDuty, OpsGenie, VictorOps and Webhooks. Send in your custom metrics with StatsD and Graphite interfaces built into each agent.