MySQL Monitoring
MySQL monitoring is fast and easy to setup with OpsDash. OpsDash makes it easy to monitor your MySQL servers, including replication at both master and slave instance sides. OpsDash dashboards come pre-configured, setup to monitor the most common MySQL metrics. No messing around with individual metrics, figuring out which of them are important, no editing graph templates. This means that you can start monitoring your MySQL instance right away, since it takes just a couple minutes to setup OpsDash monitoring.
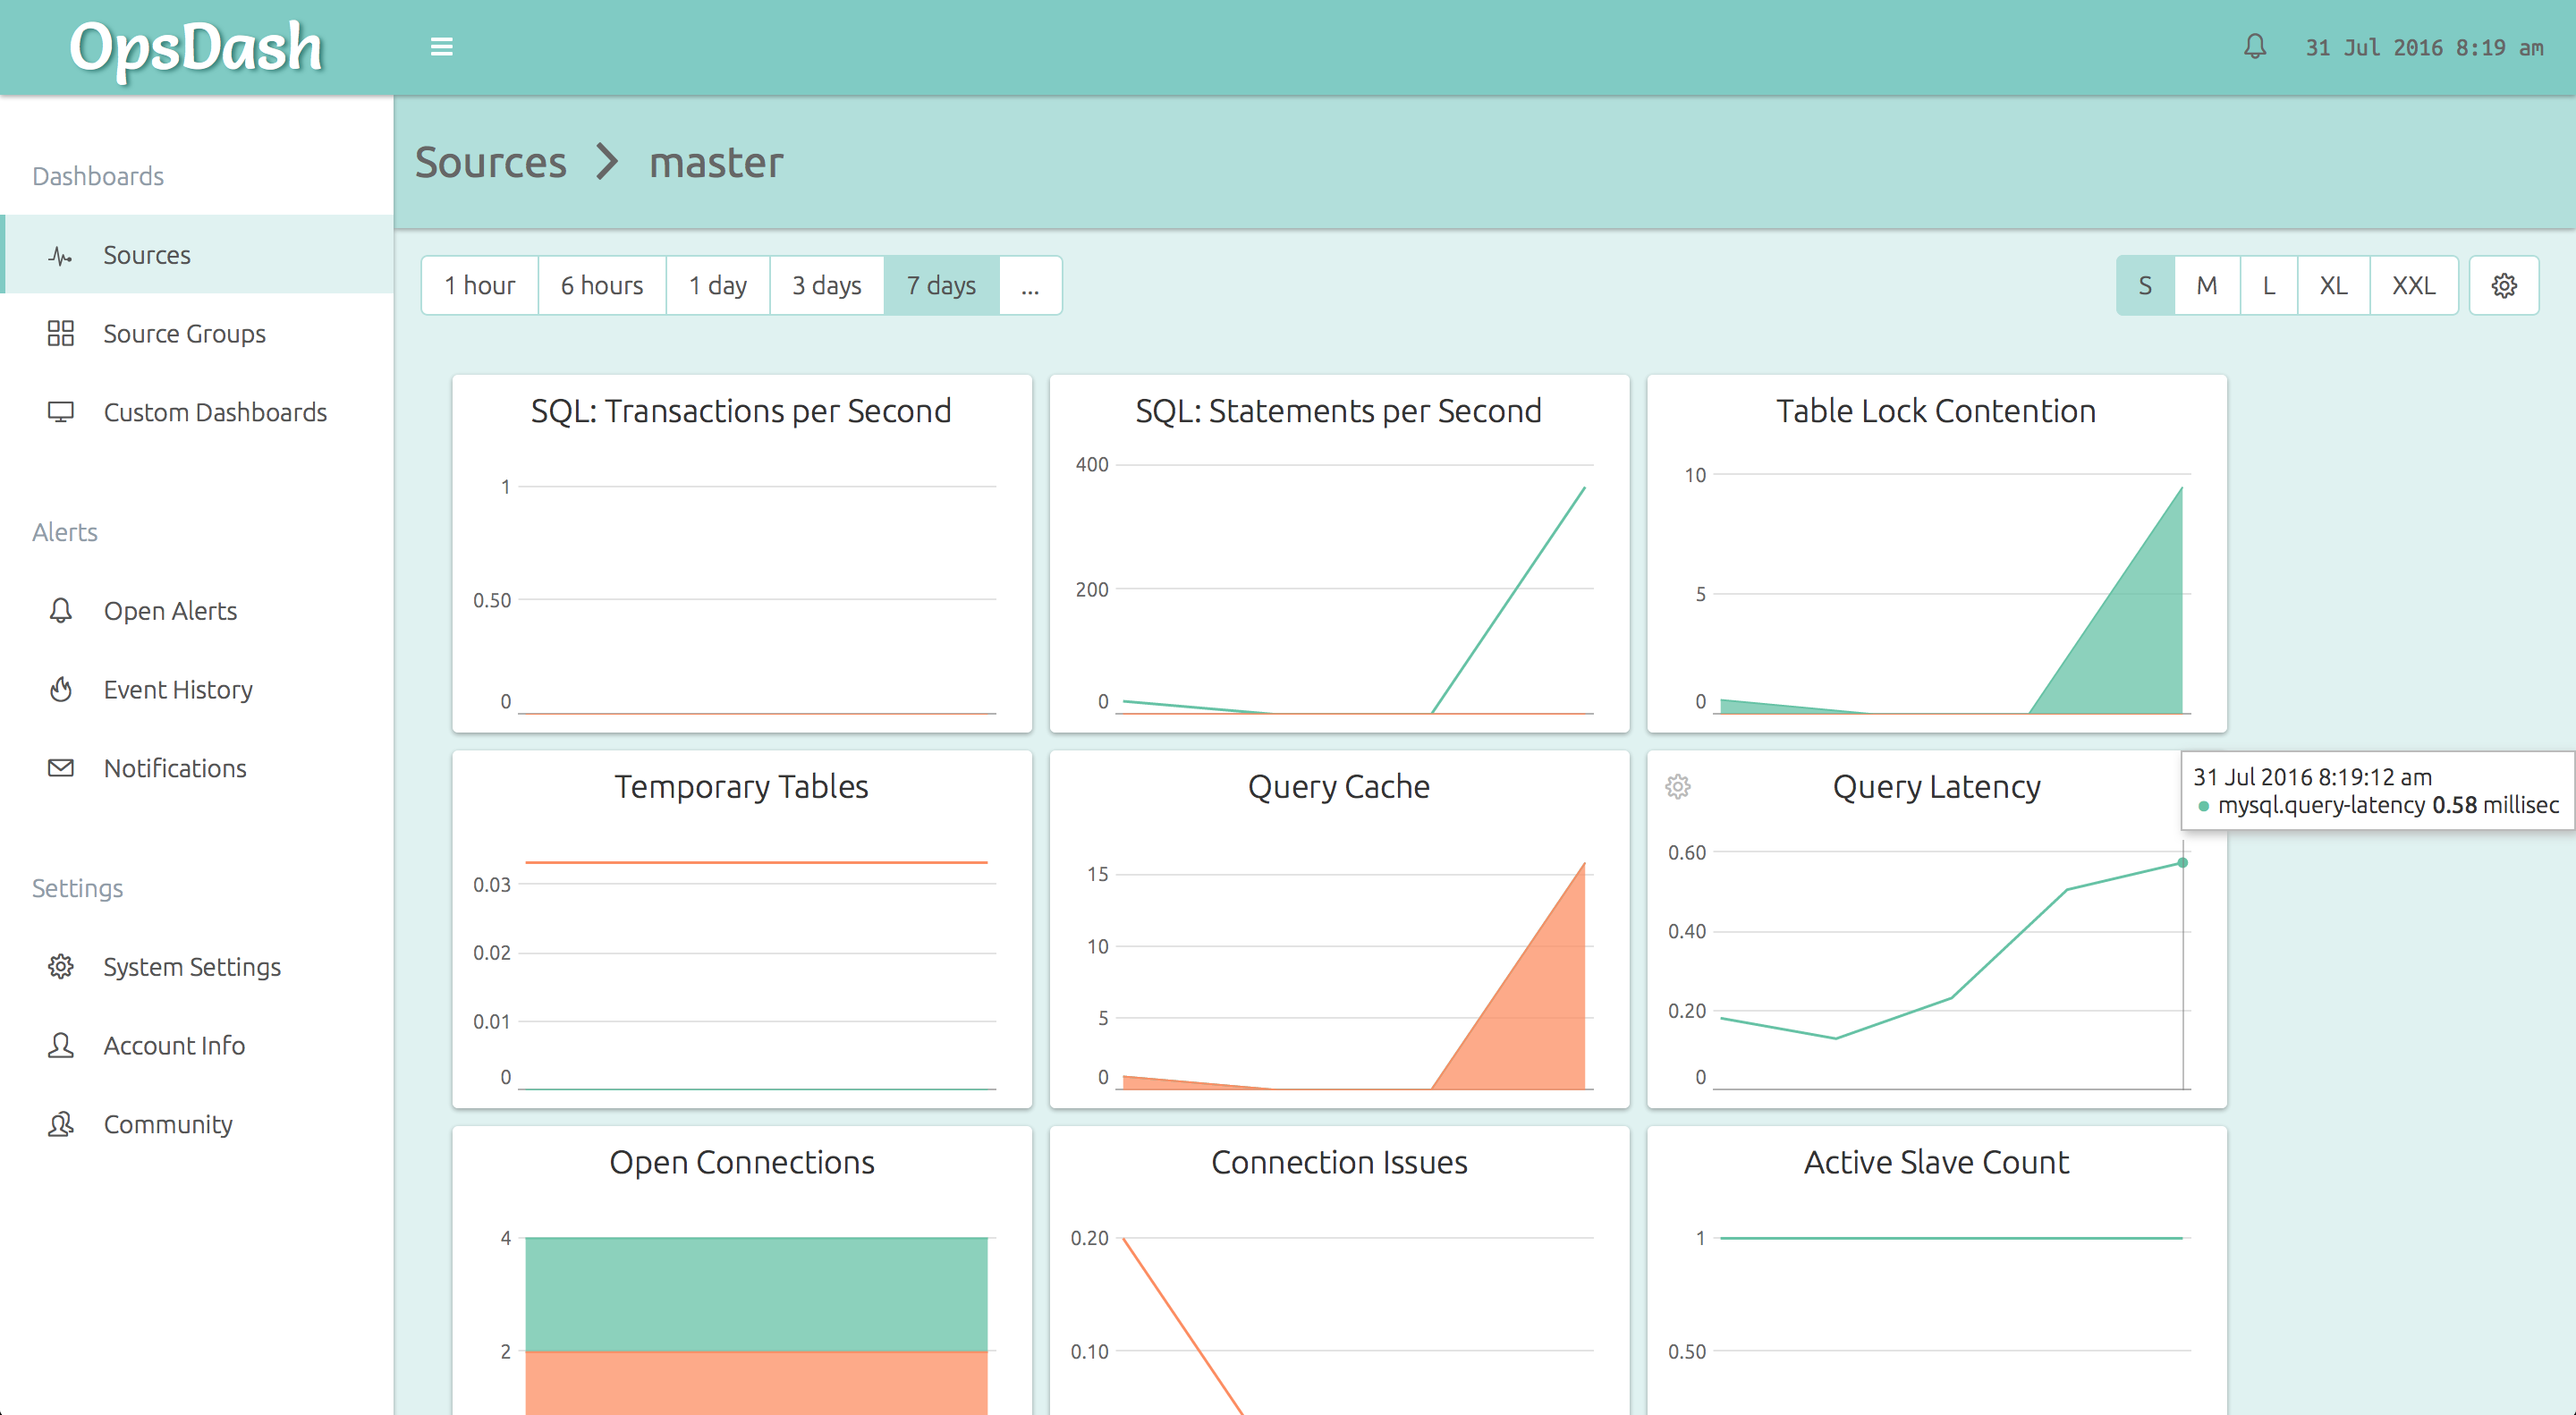
Here’s how OpsDash’s curated dashboards come out of the box:
You can go from 0 to this in just a minute or two! Typically, all that’s needed to ensure effective monitoring is to observe the data for a while and set alerts to notify you via Email, Slack, HipChat or PagerDuty if things go wrong.
If your setup requires that you monitor some additional metrics, that’s easy too. You can add and delete metrics and customize your MySQL monitoring setup to meet any unique monitoring needs you may have.
OpsDash MySQL dashboard comes out the box with these graphs:
- SQL: Transactions Per Second - The number of transactions each second, with commits and rollbacks counted separately.
- SQL: Statements per Second - The number of statements that are executed each second. The number of slow statements are counted separately.
- Table Lock Contention - The lock contention, with immediate and contented locks counted separately.
- Temporary Tables - The count of in-memory and on-disk temporary tables.
- Query Cache - The query cache efficiency, showing the counts of hits and misses per second.
- Query Latency - The time taken to execute a simple prepared statement.
- Open Connections - The currently open connection count, with running and sleeping connections counted separately.
- Connection Issues - Client aborts and connect failures, per second.
- Active Slave Count (master only) - On a replication master, this shows the count of currently active slaves.
- Slave Threads (slave only) - On a replication slave, this shows the number of slave I/O and SQL threads.
- Replication Lag (slave only) - On a replication slave, this shows the number of seconds by which the replication lags behind the master.
Learn More:
- Blog Post: Monitoring MySQL Servers with OpsDash
- Blog Post: How to Setup MySQL 5.7 Replication with Monitoring on Ubuntu 16.04
New here?
OpsDash is a comprehensive solution for server monitoring, service monitoring, database monitoring and application metrics monitoring. You can use OpsDash for monitoring MySQL, PostgreSQL, MongoDB, memcache, Redis, Apache, Nginx, Elasticsearch and more. It provides intelligent, customizable dashboards and spam-free alerting via email, HipChat, Slack, PagerDuty, OpsGenie, VictorOps and Webhooks. Send in your custom metrics with StatsD and Graphite interfaces built into each agent.