Redis Monitoring
With OpsDash, you can quickly start monitoring Redis, and get instant insight into key performance and health metrics. OpsDash dashboards come pre-configured, setup to monitor the most important Redis metrics. No messing around with individual metrics, figuring out which of them are important, no editing graph templates.
Here’s how OpsDash’s curated dashboards come out of the box:
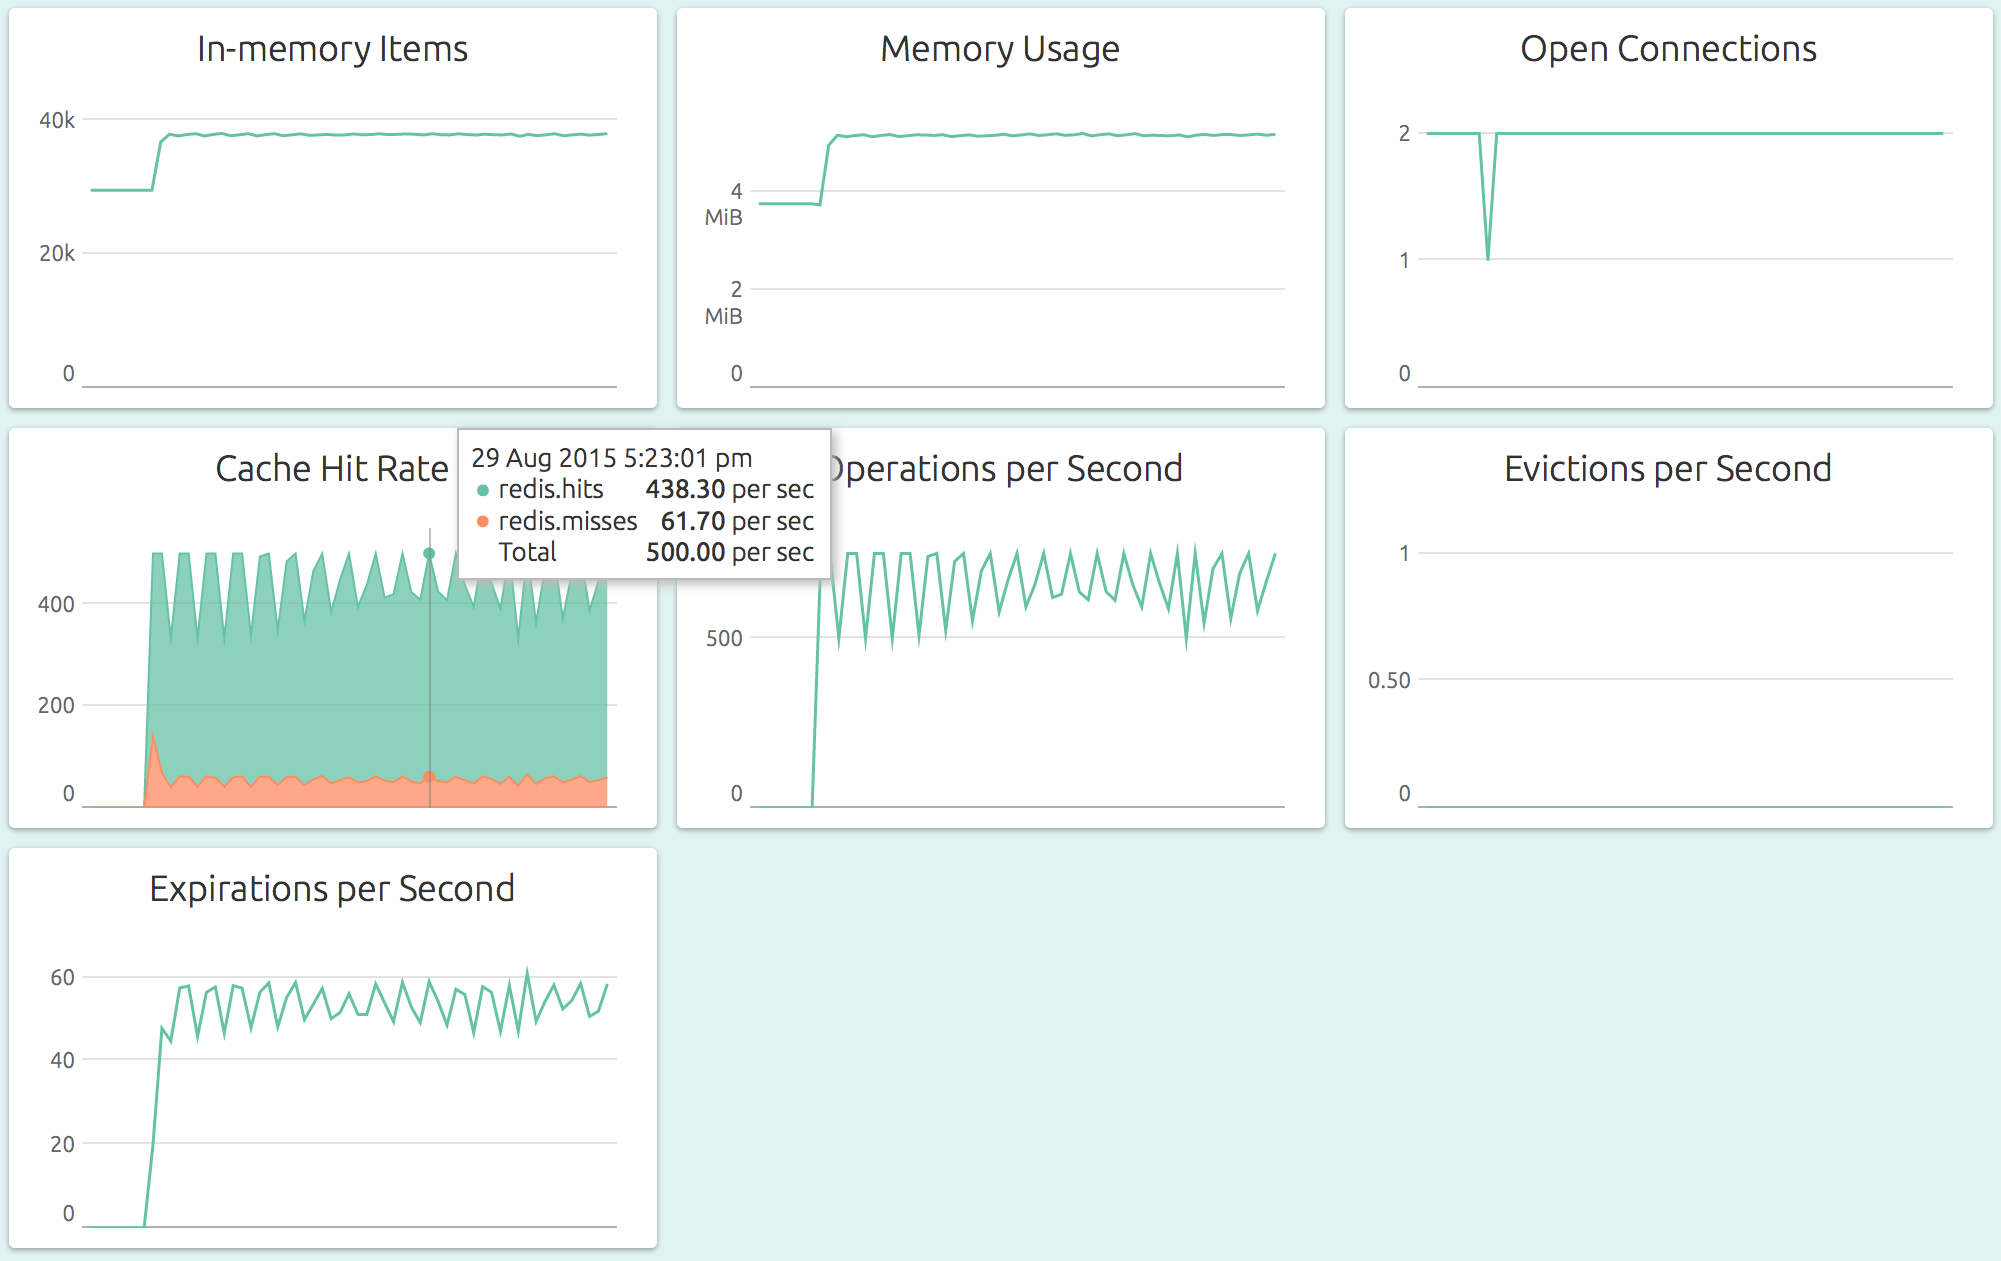
You can go from 0 to this in just a minute or two! OpsDash strives to save you the tedious work of setting up a useful dashboard. The metrics you see here were carefully chosen to ensure effective Redis monitoring.
This dashboard shows key metrics relevant to the Redis instance’s health and performance:
- In-memory Items: The number of items currently resident in memory.
- Memory Usage: The memory used by all the items that are currently resident in memory.
- Open Connections: The total number of connections that are currently open.
- Cache Hit Rate: The count of hits and misses that happen each second.
- Operations per Second: The number of operations that are being performed each second.
- Evictions per Second: The number of items that are evicted each second.
- Expirations per Second: The number of items that expire each second.
- Latency: The time taken by the Redis instance to start responding to a command.
You’ll want to set warning and critical upper limits for these metrics so that you can identify and address emerging issues before they bite. You can quickly setup your alerts in OpsDash and send notifications by Slack, Hipchat, OpsGenie, PagerDuty or Email.
If your setup requires that you monitor some additional metrics, that’s easy too. Each OpsDash agent includes the industry-standard statsd interface (and even a graphite interface) to easily report custom metrics.
With OpsDash, Redis monitoring is fast and easy. Try it!
Learn More:
New here?
OpsDash is a comprehensive solution for server monitoring, service monitoring, database monitoring and application metrics monitoring. You can use OpsDash for monitoring MySQL, PostgreSQL, MongoDB, memcache, Redis, Apache, Nginx, Elasticsearch and more. It provides intelligent, customizable dashboards and spam-free alerting via email, HipChat, Slack, PagerDuty, OpsGenie, VictorOps and Webhooks. Send in your custom metrics with StatsD and Graphite interfaces built into each agent.