Elasticsearch Monitoring
Elasticsearch monitoring is fast and easy to setup with OpsDash. You can start monitoring your Elasticsearch cluster, nodes and indexes right away, thanks to OpsDash’s smart dashboards that display the most important health and performance metrics with zero additional configuration. No messing around with individual metrics, figuring out which of them are important, no editing graph templates.
OpsDash offers Elasticsearch monitoring integration at three levels:
- Overall Cluster-level Metrics for quick, aggregated overview of storage, JVM memory usage, segments and node and shard status
- Index-specific Metrics for a detailed look at a single Elasticsearch index, including storage, segment and merge related metrics
- Node-specific Metrics for a detailed look at a single node of the cluster, including storage, memory usage, index and query rates and cache efficiencies of various caches
Below you can see how OpsDash’s curated dashboards come out of the box. You can go from 0 to this in just a few minutes!
Cluster Level
The Cluster-level OpsDash dashboard gives a quick, aggregated overview of storage, JVM memory usage, segments and node and shard status.
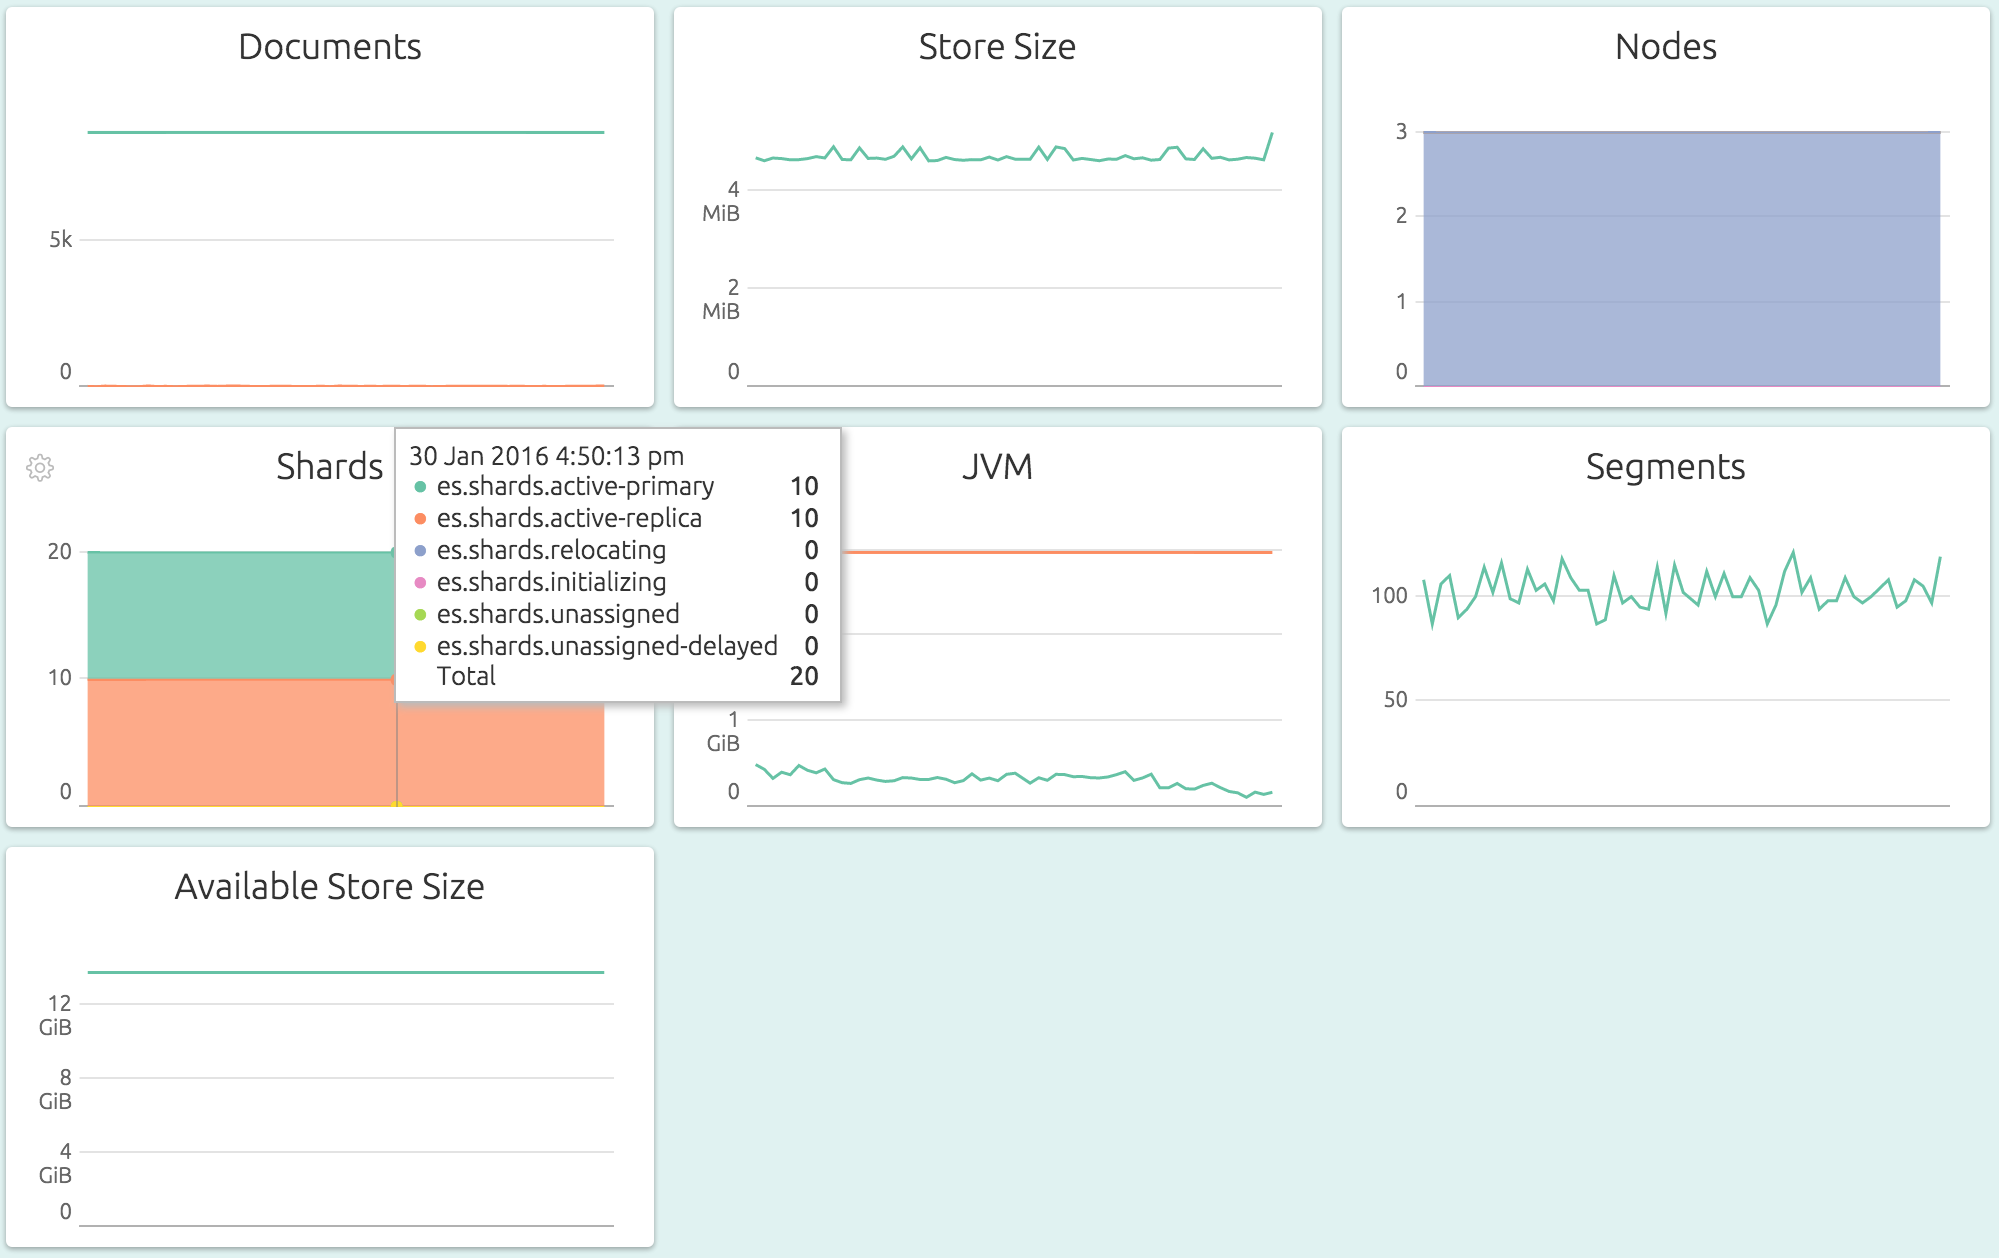
OpsDash Elasticsearch cluster dashboard comes out the box with these graphs:
- Documents - The number of deleted and live documents across the whole cluster.
- Store Size - The total storage used, in bytes, across the whole cluster.
- Nodes - The count of nodes. In Elasticsearch 2.x, this is segregated by the type of the node: master, data, master+data and client. In Elasticsearch 5.x, this is line graph of nodes of type: master, data, ingest and coordinating-only.
- Shards - The count of shards, segregated by type: active-primary, active-replica, relocating, initializing, unassigned and unassigned-delayed.
- JVM - The total heap size, in bytes, totalled across all JVMs in the cluster. Both used and max heap sizes are shown.
- Segments - The total number of Lucene segments across the whole cluster.
- Available Store Size - The total available store size in bytes, across the whole cluster.
Index Level
The Index-level OpsDash dashboard gives a detailed look at a single Elasticsearch index, including storage, segment and merge related metrics.
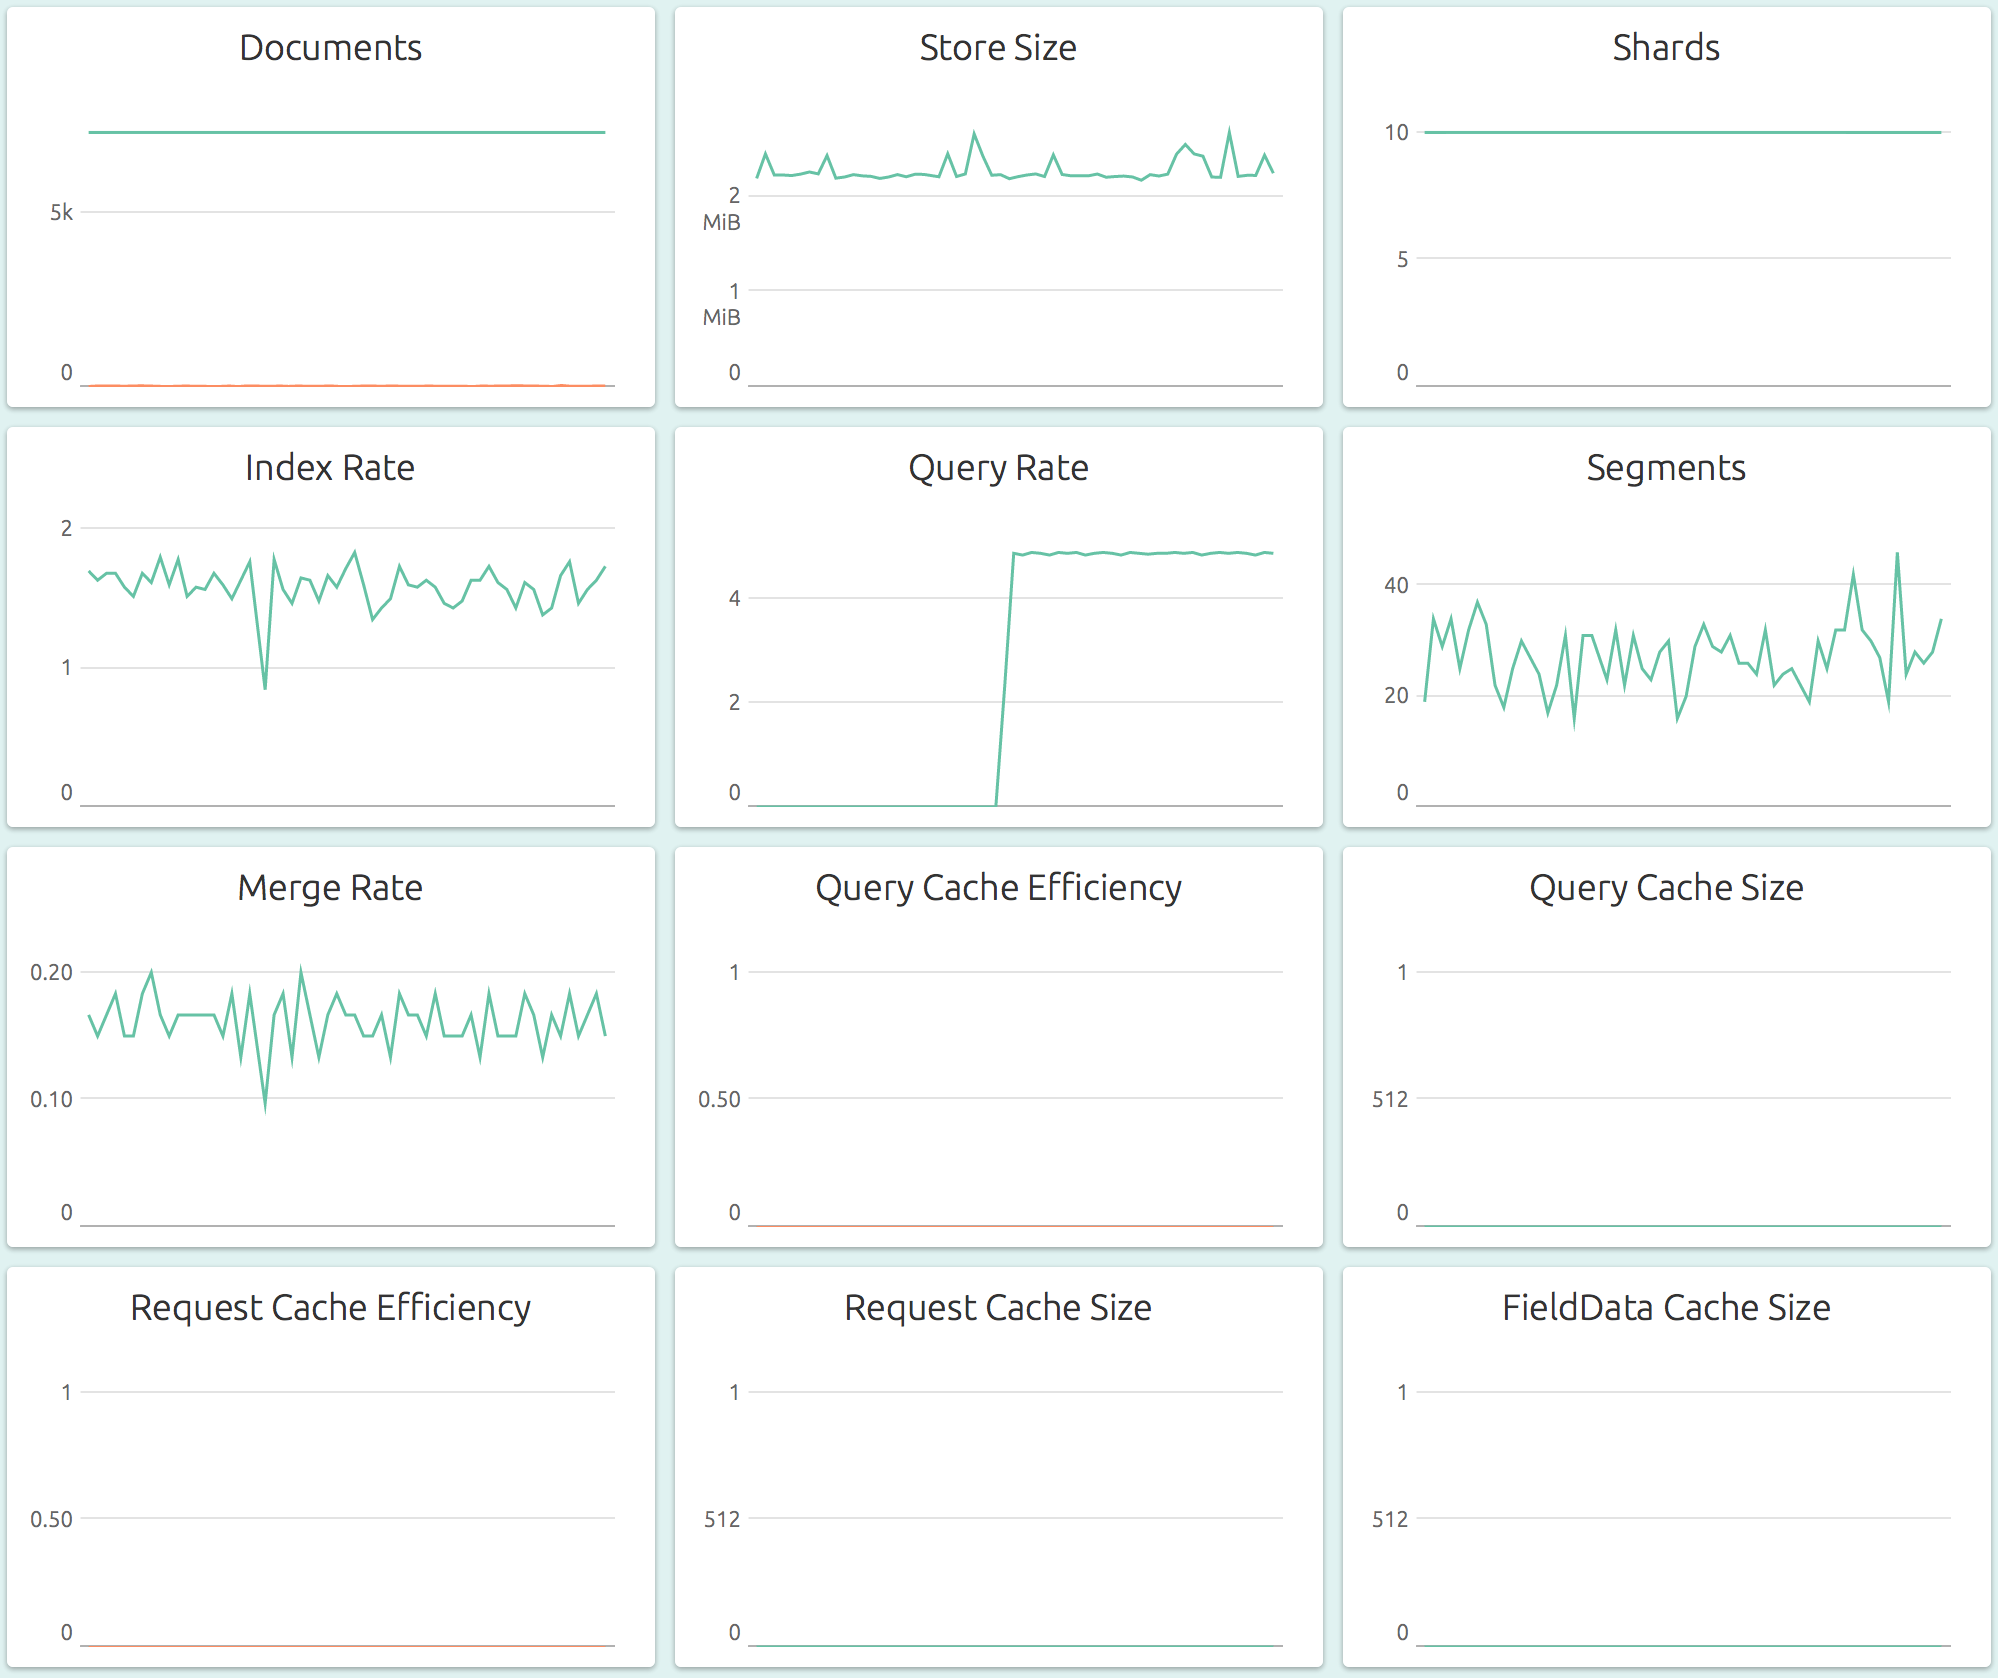
OpsDash Elasticsearch index dashboard comes out the box with these graphs:
- Documents - The number of deleted and live documents in this index.
- Store Size - The total storage in bytes used by documents in this index.
- Shards - The count of shards in this index.
- Index Rate - The rate at which documents are being indexed in this index.
- Query Rate - The rate at which documents are being queried in this index.
- Segments - The total number of Lucene segments in this index.
- Merge Rate - The rate at which segments are being merged in this index.
- Query Cache Efficiency - The hits and misses that occur per second, on the query cache for this index.
- Query Cache Size - The size in bytes, of the total memory allocated for the query cache.
- Request Cache Efficiency - The hits and misses that occur per second, on the request cache for this index.
- Request Cache Size - The size in bytes, of the total memory allocated for the request cache.
- FieldData Cache Size - The size in bytes, of the total memory allocated for the fielddata cache.
Node Level
Nodes are usually the best things to monitor in an Elasticsearch cluster, and OpsDash has the richest dashboards at the node level.
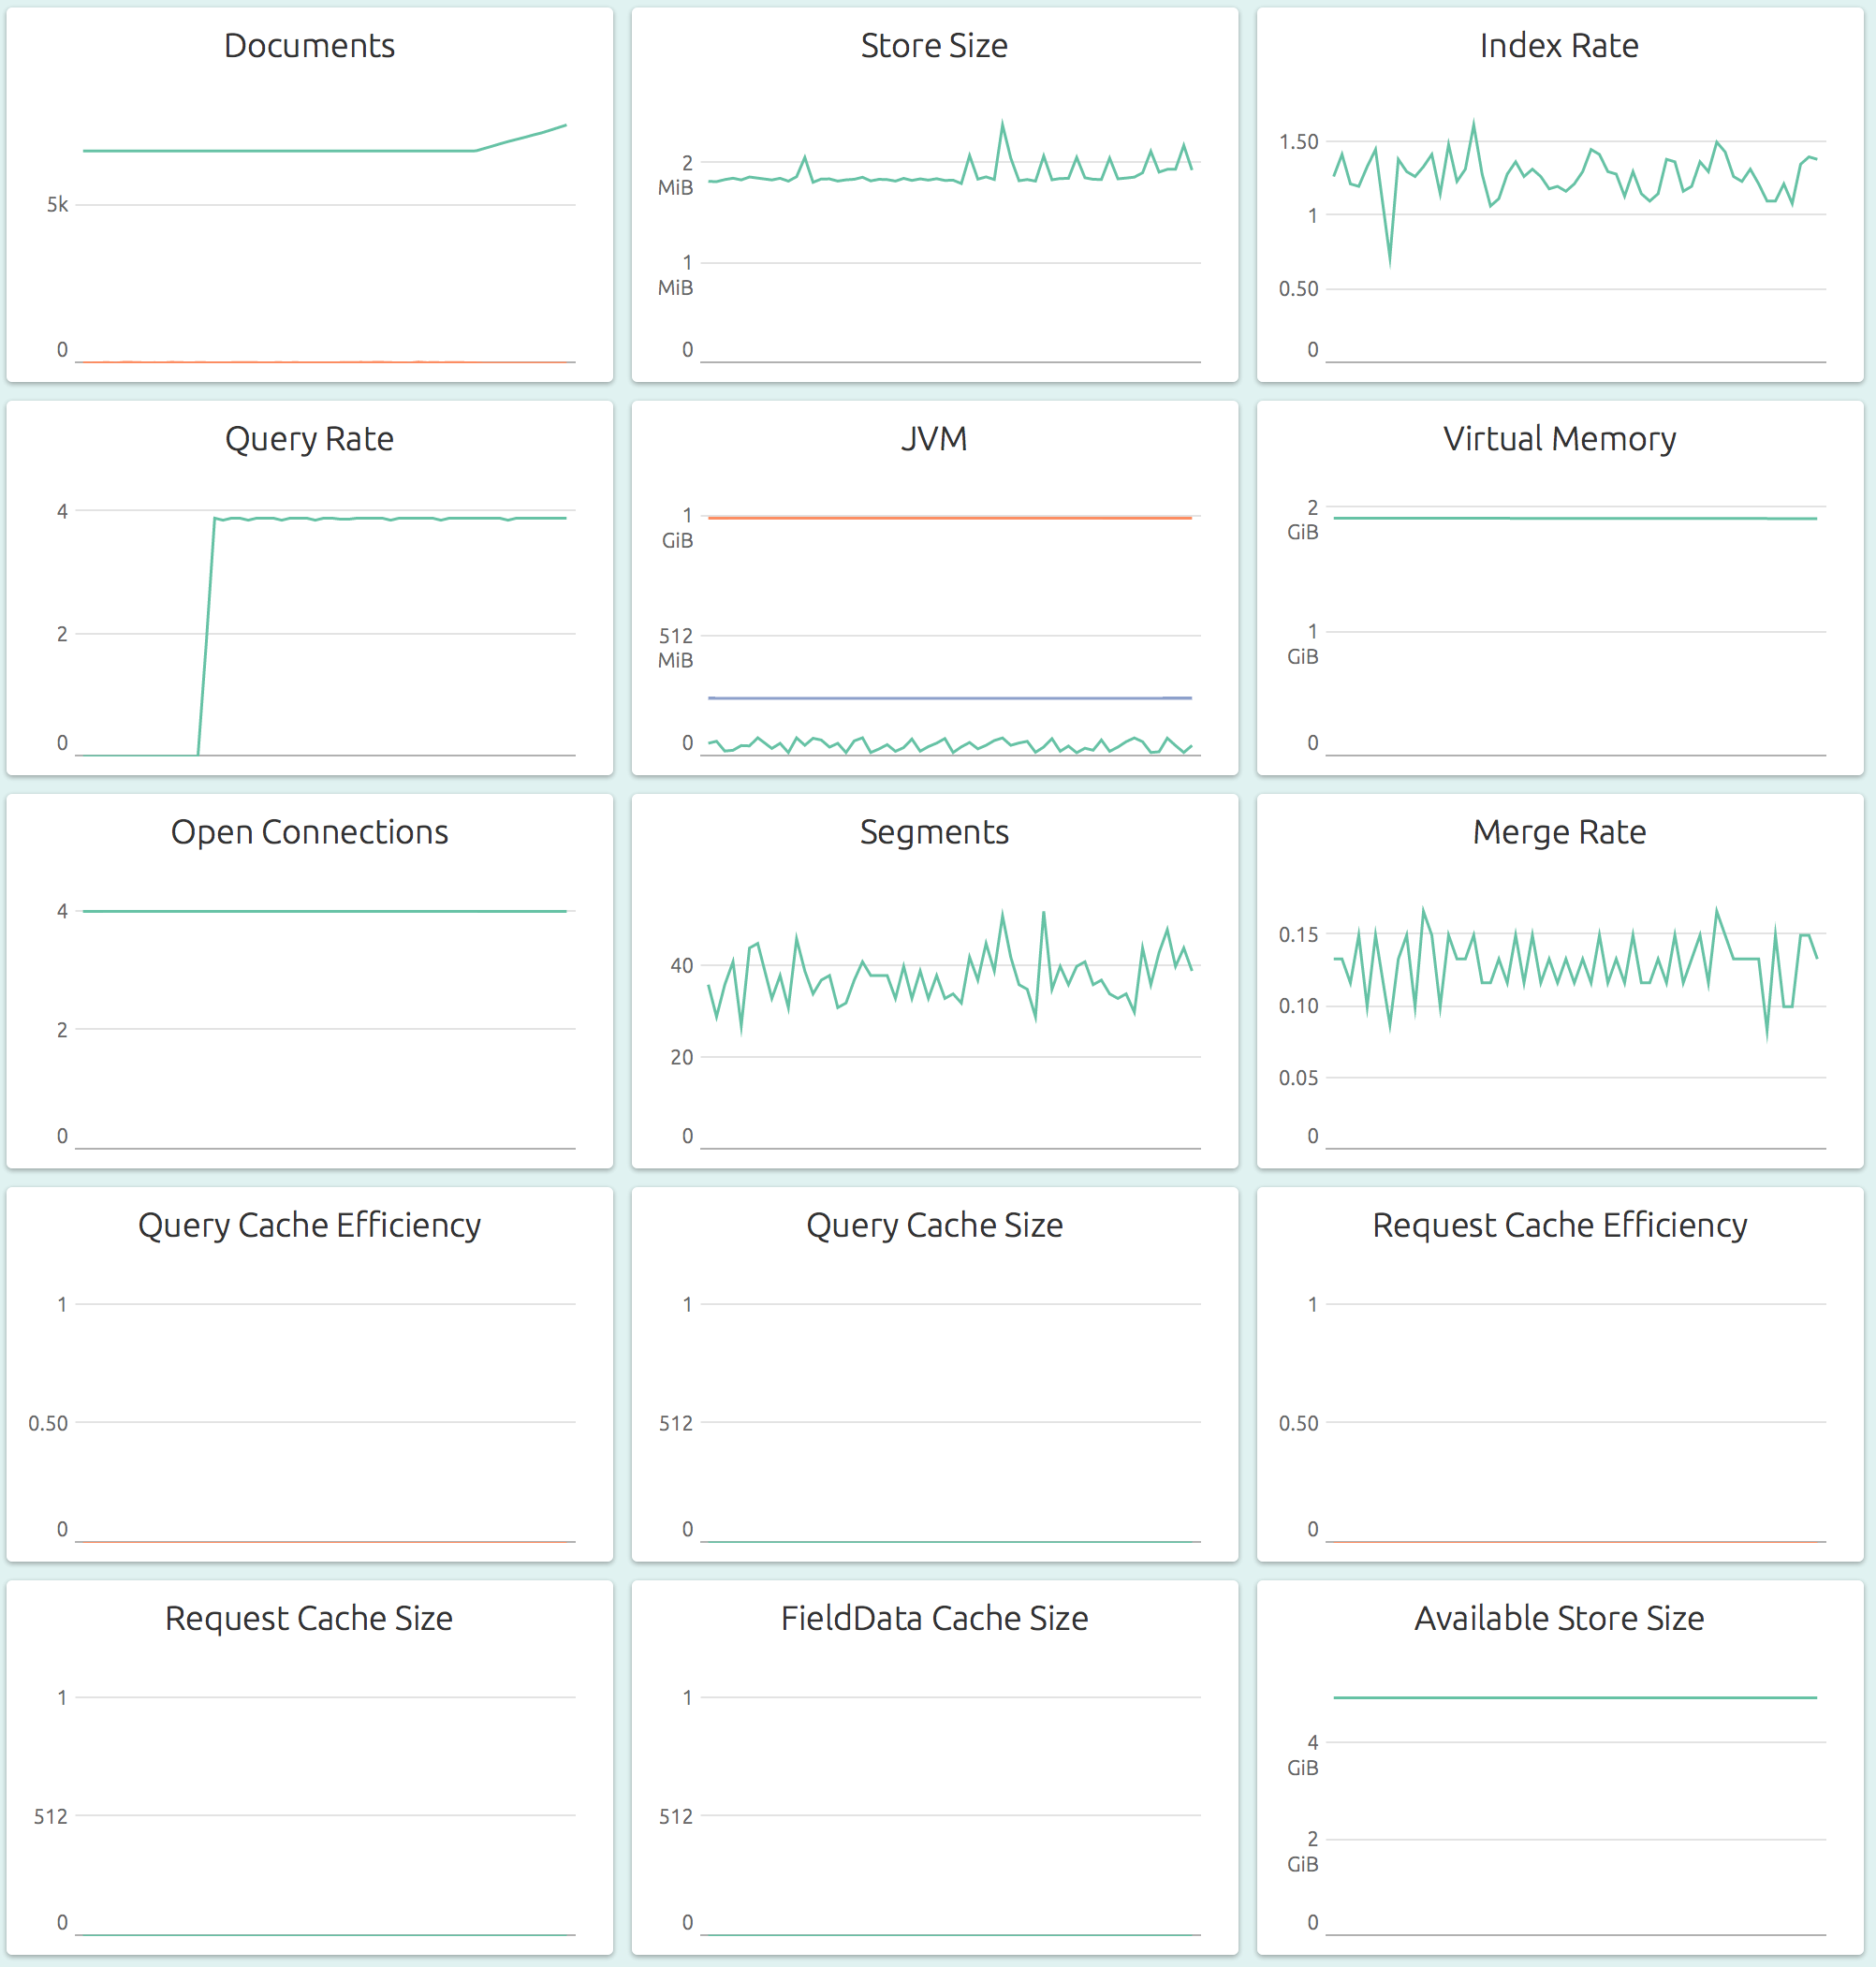
OpsDash Elasticsearch node dashboard comes out the box with these graphs:
- Documents - The number of deleted and live documents on this node.
- Store Size - The total storage in bytes used by documents on this node.
- Index Rate - The rate at which documents are being indexed on this node.
- Query Rate - The rate at which documents are being queried on this node.
- JVM - The total heap size, in bytes, used by the JVM running on this node. Used, Max and Committed heap sizes are shown.
- Virtual Memory - The virtual memory allocated by the Elasticsearch process on this node.
- Open Connections - The number of currently open (HTTP) connections.
- Segments - The total number of Lucene segments on this node.
- Merge Rate - The rate at which segments are being merged on this node.
- Query Cache Efficiency - The hits and misses that occur per second, on the query cache for this node.
- Query Cache Size - The size in bytes, of the total memory allocated for the query cache.
- Request Cache Efficiency - The hits and misses that occur per second, on the request cache for this node.
- Request Cache Size - The size in bytes, of the total memory allocated for the request cache.
- FieldData Cache Size - The size in bytes, of the total memory allocated for the fielddata cache.
- Available Store Size - The total available store size in bytes on this node.
If your setup requires that you monitor some additional metrics, that’s easy too. You can add and delete metrics and customize your ElasticSearch monitoring setup to meet any unique monitoring needs you may have.
Learn More:
- Blog Post: How to Setup a Secure Elasticsearch 5.2 Server with Monitoring
- Blog Post: How to Setup an Elasticsearch Cluster with Monitoring
- Blog Post: Elasticsearch Monitoring with OpsDash
New here?
OpsDash is a comprehensive solution for server monitoring, service monitoring, database monitoring and application metrics monitoring. You can use OpsDash for monitoring MySQL, PostgreSQL, MongoDB, memcache, Redis, Apache, Nginx, Elasticsearch and more. It provides intelligent, customizable dashboards and spam-free alerting via email, HipChat, Slack, PagerDuty, OpsGenie, VictorOps and Webhooks. Send in your custom metrics with StatsD and Graphite interfaces built into each agent.