PostgreSQL Monitoring
With OpsDash, you can quickly start monitoring your PostgreSQL servers, and get instant insight into key performance and health metrics like Transactions per Second, Replication Lag, Block Cache Efficiency and more. OpsDash dashboards come pre-configured, setup to monitor the most important PostgreSQL metrics. No messing around with individual metrics, figuring out which of them are important, no editing graph templates. This means that you can start monitoring your PostgreSQL instances right away, since it takes just a couple minutes to setup OpsDash monitoring.
With OpsDash, you can also get instant insight into key performance and health metrics about PostgrSQL WAL archiving and streaming replication too.
If your setup requires that you monitor some additional metrics, that’s easy too. Each OpsDash agent includes the industry-standard statsd interface (and even a graphite interface) to easily report custom metrics.
Here’s how OpsDash’s curated dashboards come out of the box:
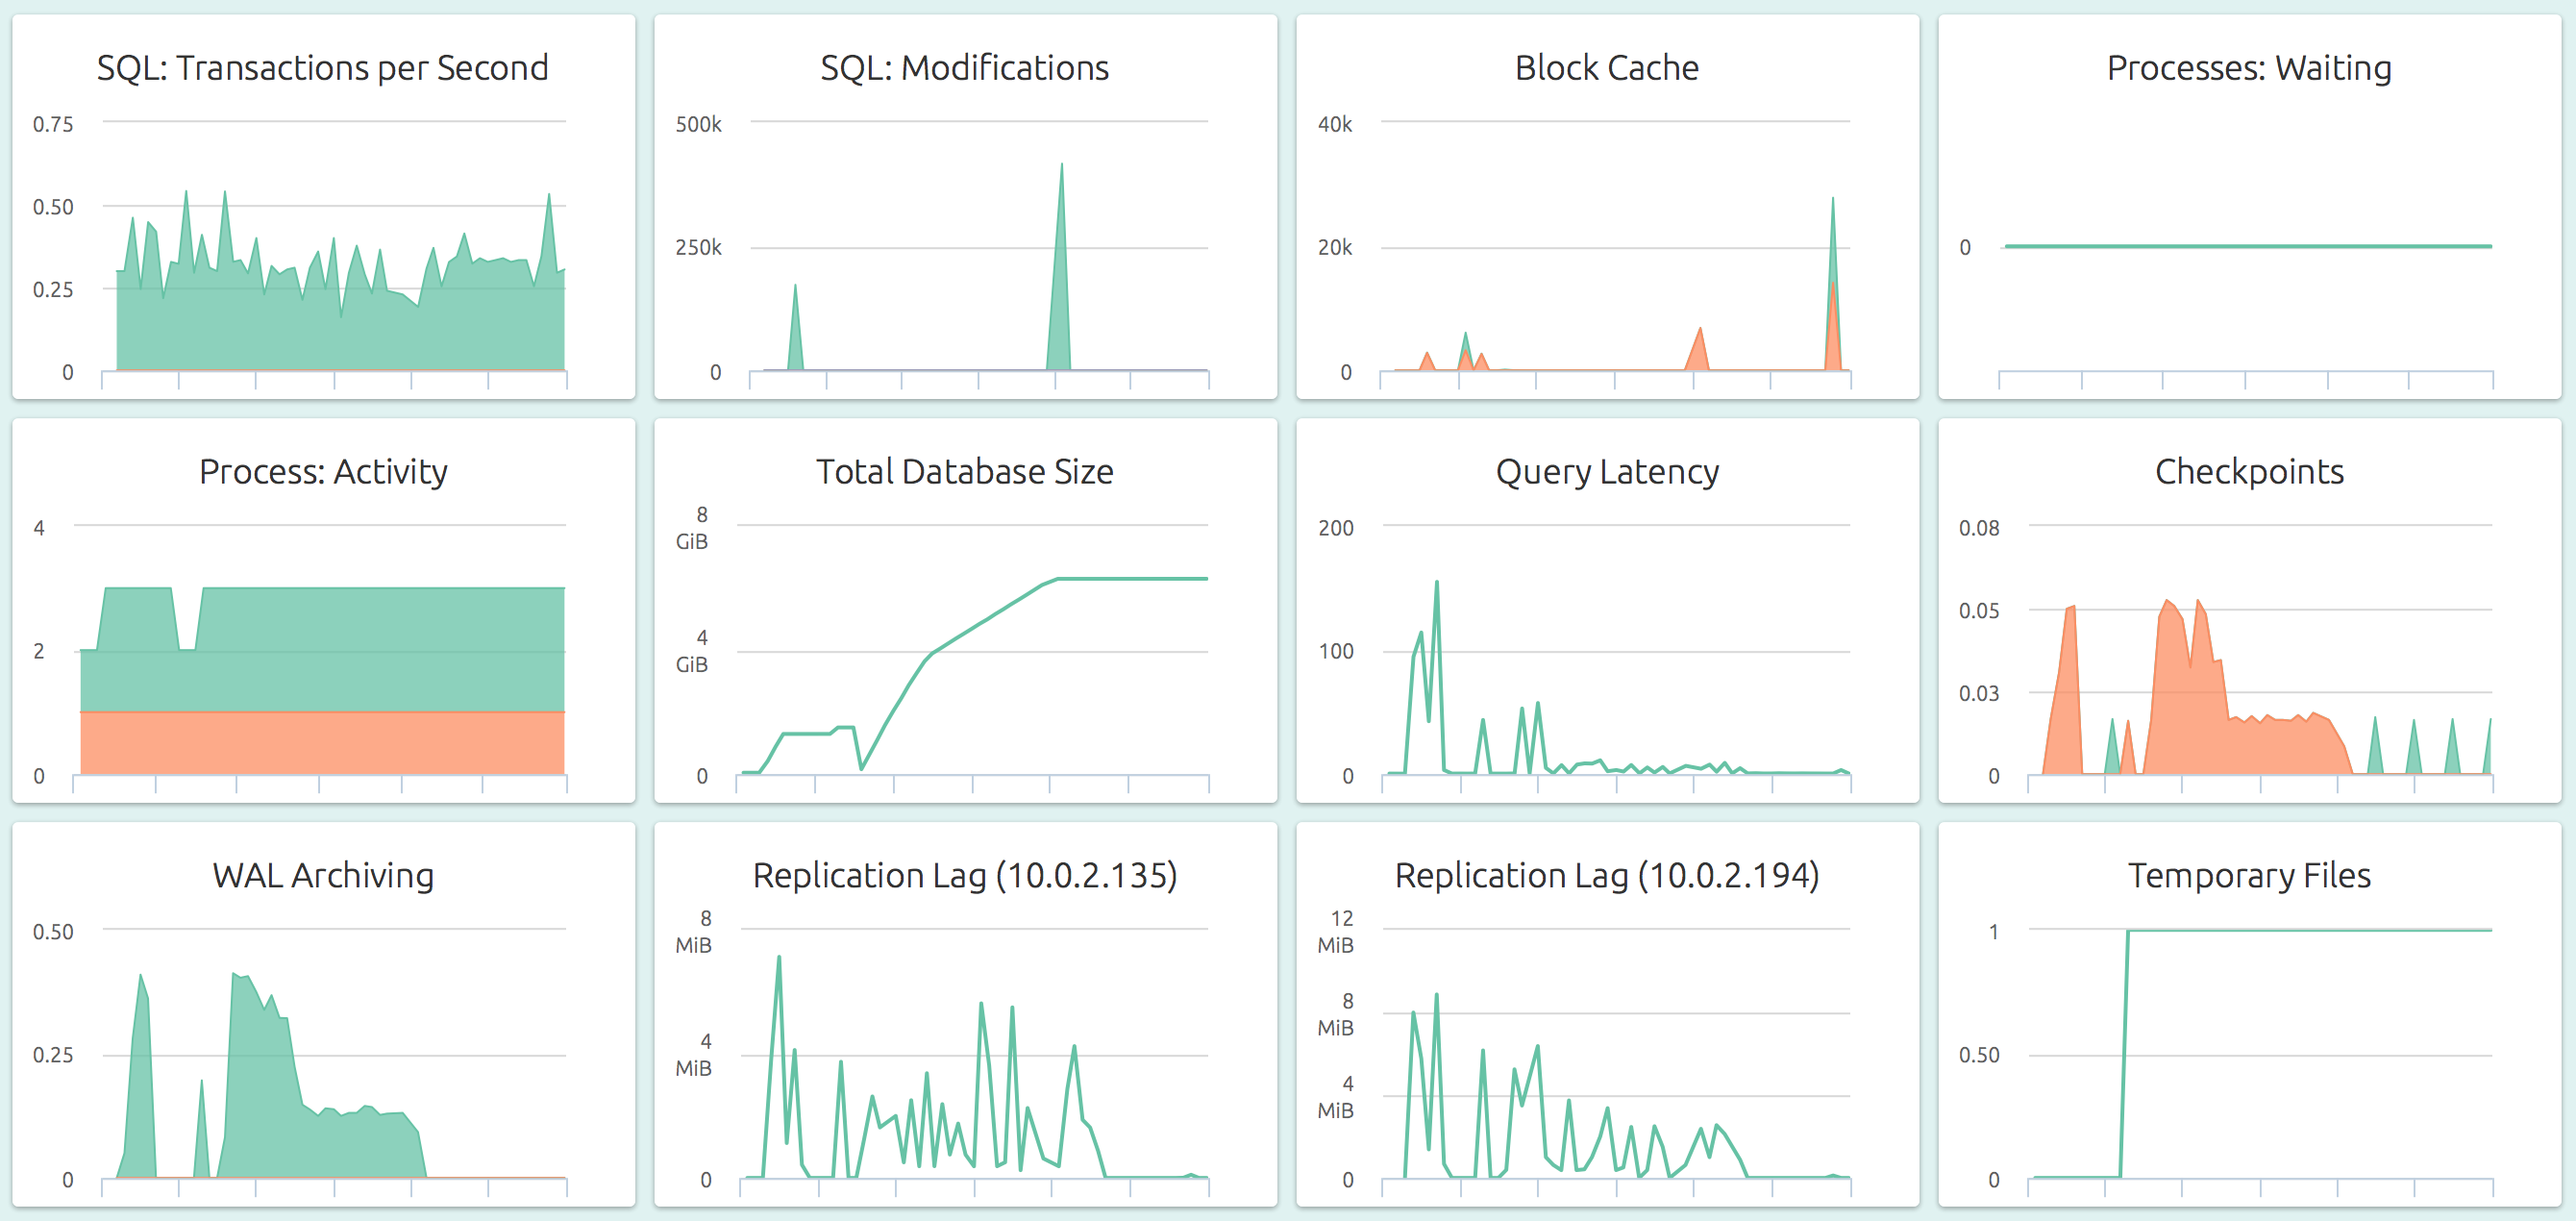
You can go from 0 to this in just a minute or two! OpsDash strives to save you the tedious work of setting up a useful dashboard. The metrics you see here were carefully chosen to ensure effective PostgrSQL monitoring.
Monitoring WAL Archiving
With OpsDash, you can quickly start monitoring your PostgreSQL servers, and get instant insight into key performance and health metrics including WAL archiving.
Here's a graph from the OpsDash PostgreSQL dashboard showing WAL Archiving stats:
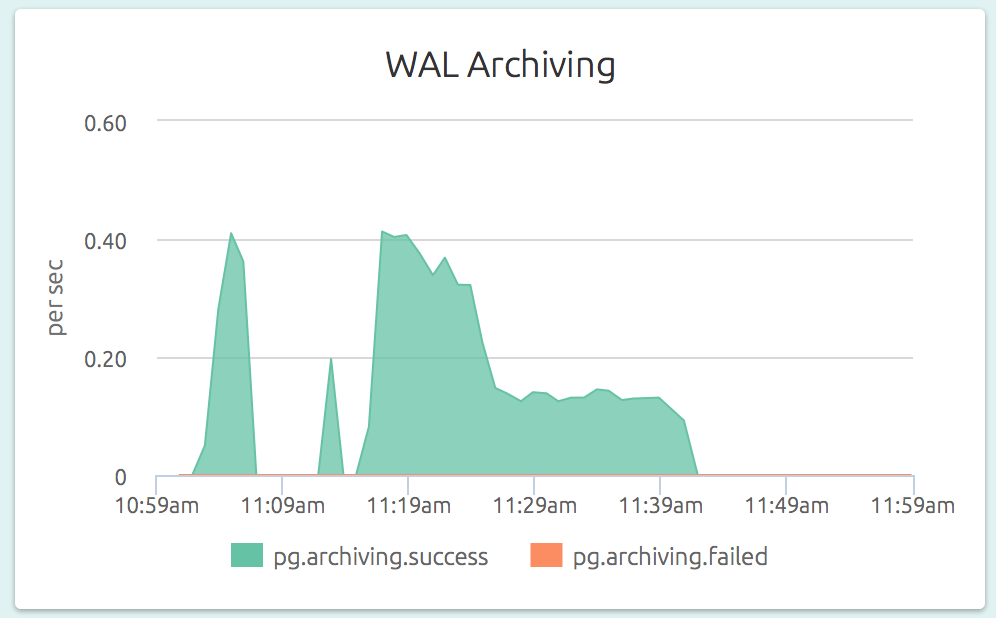
Adding a threshold-based alert to the archive failure count metric is a quick and easy way to catch a failing archival job before it gets out of control and WAL files eat away your server disk space.
PostgreSQL Replication Monitoring
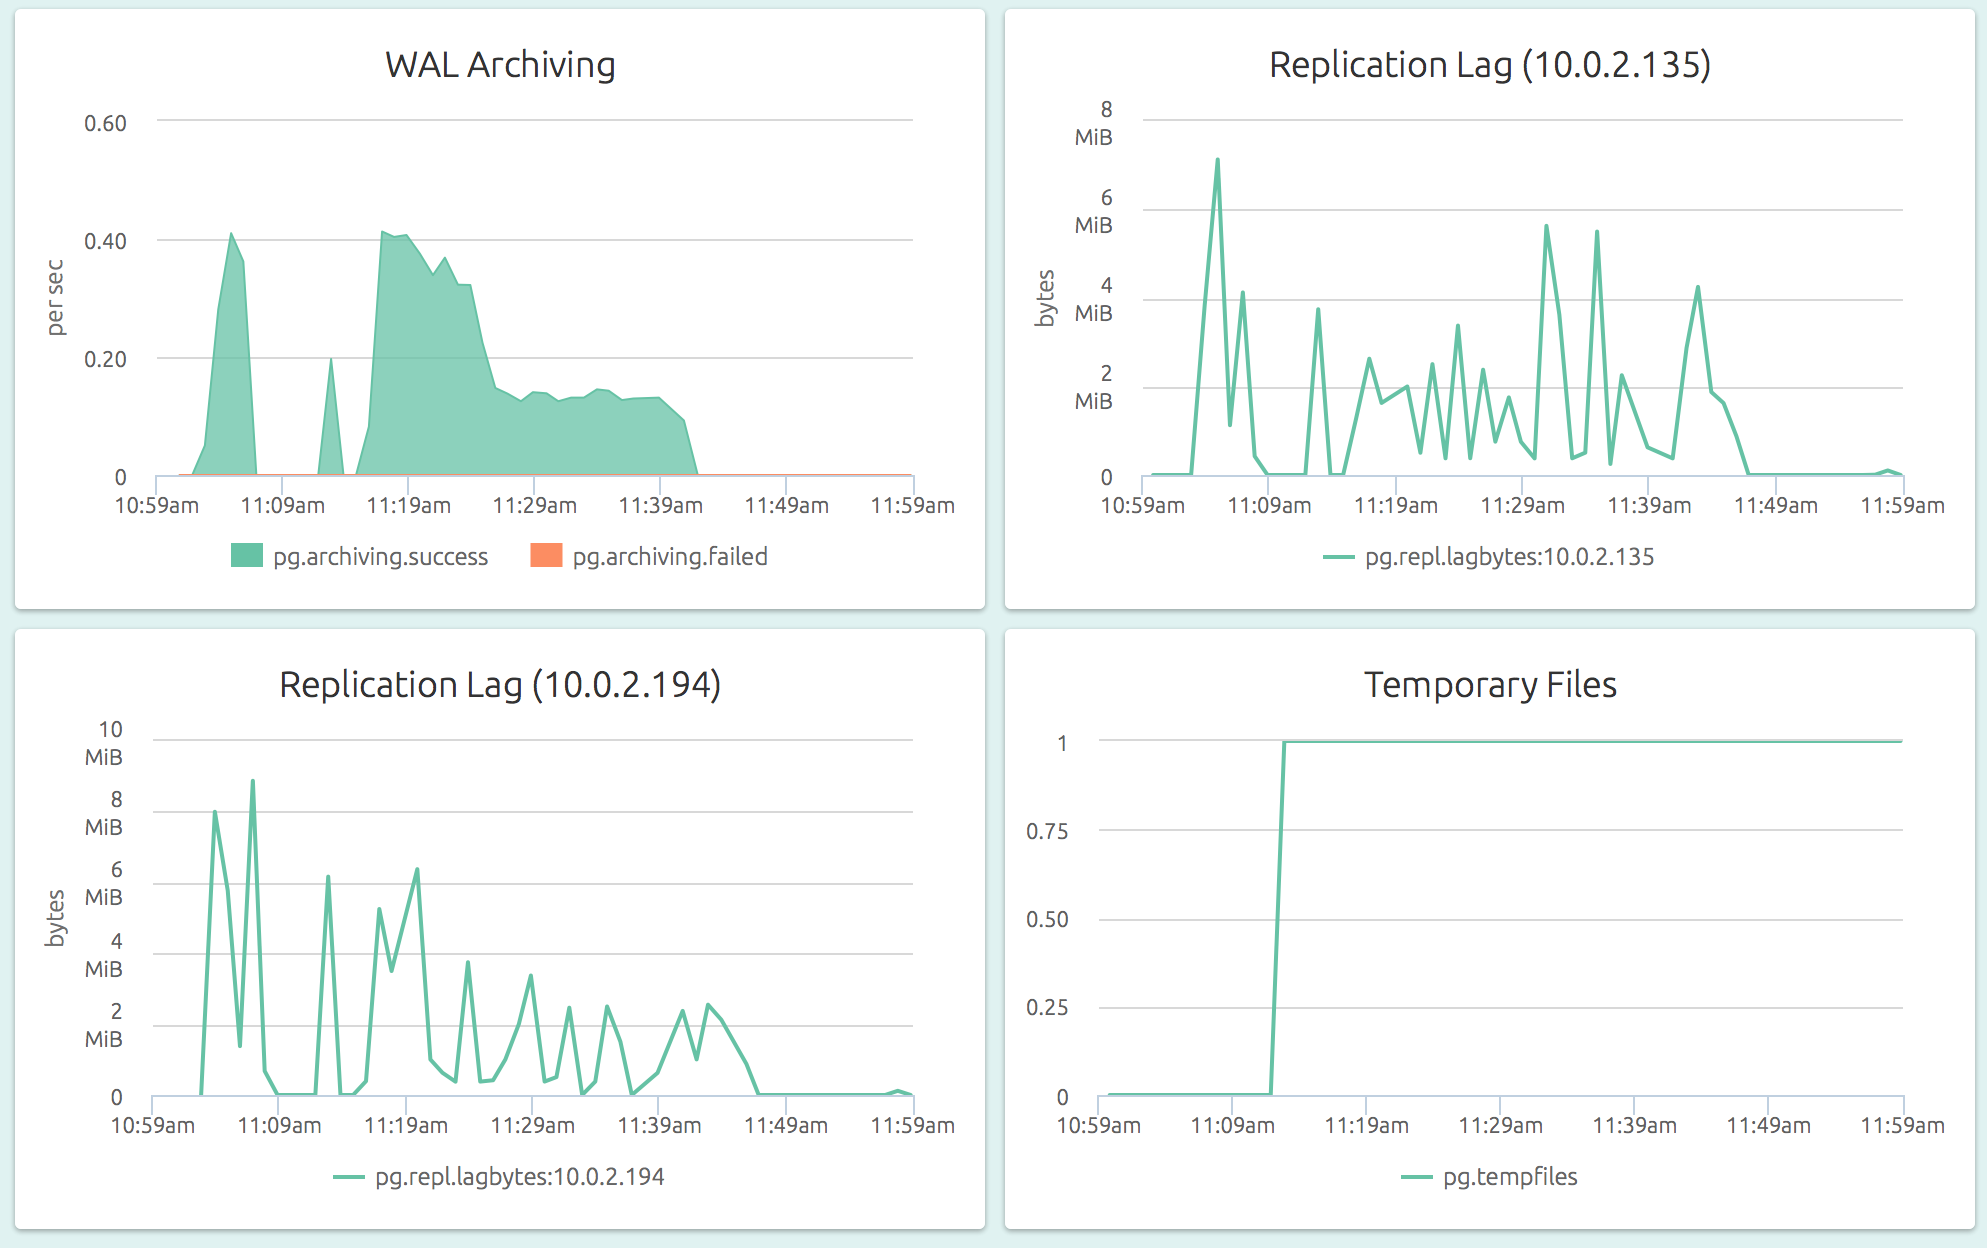
OpsDash understands the streaming replication feature of PostgreSQL as well and displays per-slave replication status on the master:
If your setup requires that you monitor some additional metrics, that’s easy too. You can add and delete metrics and customize your MySQL monitoring setup to meet any unique monitoring needs you may have.
The replication lag (as a length of time) is also visible on a slave’s dashboard. In the graph below (part of the dashboard of a slave), we can see that the slave could not catch up to the master’s changes for a while:
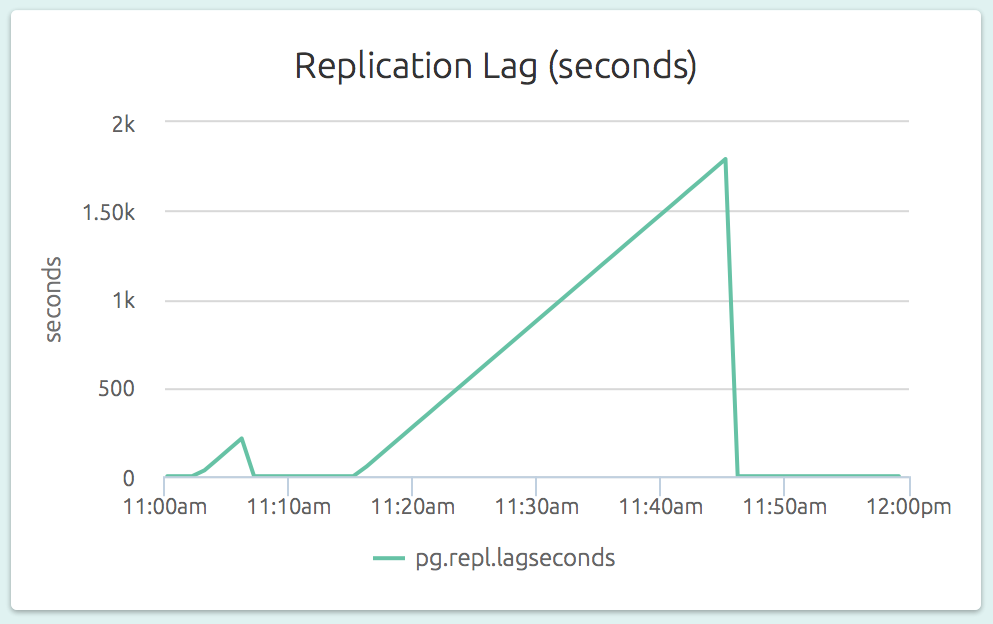
By comparing the replication lag at master side (was the master able to ship the WALs in time?) and the slave side (was the slave able to apply the incoming WALs in time?), it is easy to identify the replication bottleneck.
Adding a threshold-based alert to the replication lag metric on a slave is a quick and easy way to catch a lagging slave before it gets out of control.
With OpsDash, comprehensive PostgreSQL monitoring is fast and easy. Try it!
OpsDash PostgreSQL dashboard comes out the box with these graphs:
- SQL: Transactions Per Second - The number of transactions each second, with commits and rollbacks counted separately.
- SQL: Modifications - The number of rows created, updated and deleted per second.
- Block Cache - The block cache efficiency, showing the counts of hits and misses per second.
- Processes: Waiting - The count of processes that have been put into the wait state (waiting for locks to be relinquished, for example).
- Process: Activity - The count of active and idle processes.
- Total Database Size - The total size in bytes of all the databases managed by this PostgreSQL instance.
- Query Latency - The time taken to execute a simple prepared statement.
- Checkpoints - The number of checkpoints that occur each second, with timed and requested checkpoints counted separately.
- WAL Archiving - The number of successful and failed WAL archival attempts by the server, per second.
- Replication Lag ({slave name}) (master only) - On a replication master, this shows the replication lag to a specific slave, as the number of bytes that are yet to be sent to that slave.
- Replication Lag (slave only) - On a replication slave, this shows the number of seconds by which the replication lags behind the master.
Learn More:
- Blog Post: How to Backup and Restore PostgreSQL Databases
- Blog Post: PostgreSQL Clusters
- Blog Post: PostgreSQL WAL Archiving
- Blog Post: Using PostgreSQL Full Text Search With Golang
- Blog Post: All About PostgreSQL Streaming Replication
- Blog Post: PostgreSQL Monitoring with OpsDash
New here?
OpsDash is a comprehensive solution for server monitoring, service monitoring, database monitoring and application metrics monitoring. You can use OpsDash for monitoring MySQL, PostgreSQL, MongoDB, memcache, Redis, Apache, Nginx, Elasticsearch and more. It provides intelligent, customizable dashboards and spam-free alerting via email, HipChat, Slack, PagerDuty, OpsGenie, VictorOps and Webhooks. Send in your custom metrics with StatsD and Graphite interfaces built into each agent.