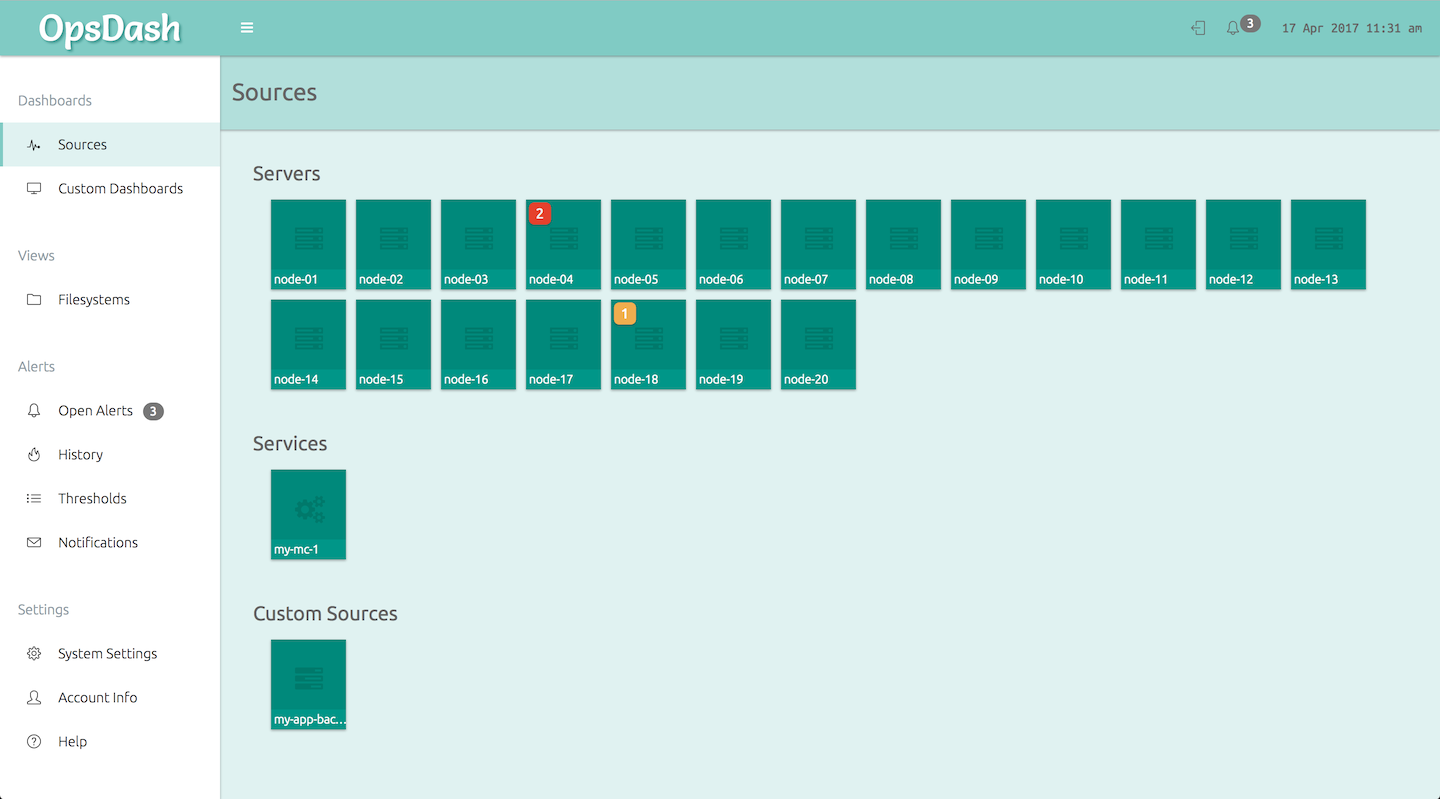
OpsDash is fast to setup and easy to use. Get started in minutes with our zero-dependancy agent and dashboards pre-configured to include key metrics for server, service and database monitoring.
Server Monitoring
Zero-dependency, single-binary agent-based monitoring of Linux servers. Powered by Golang.
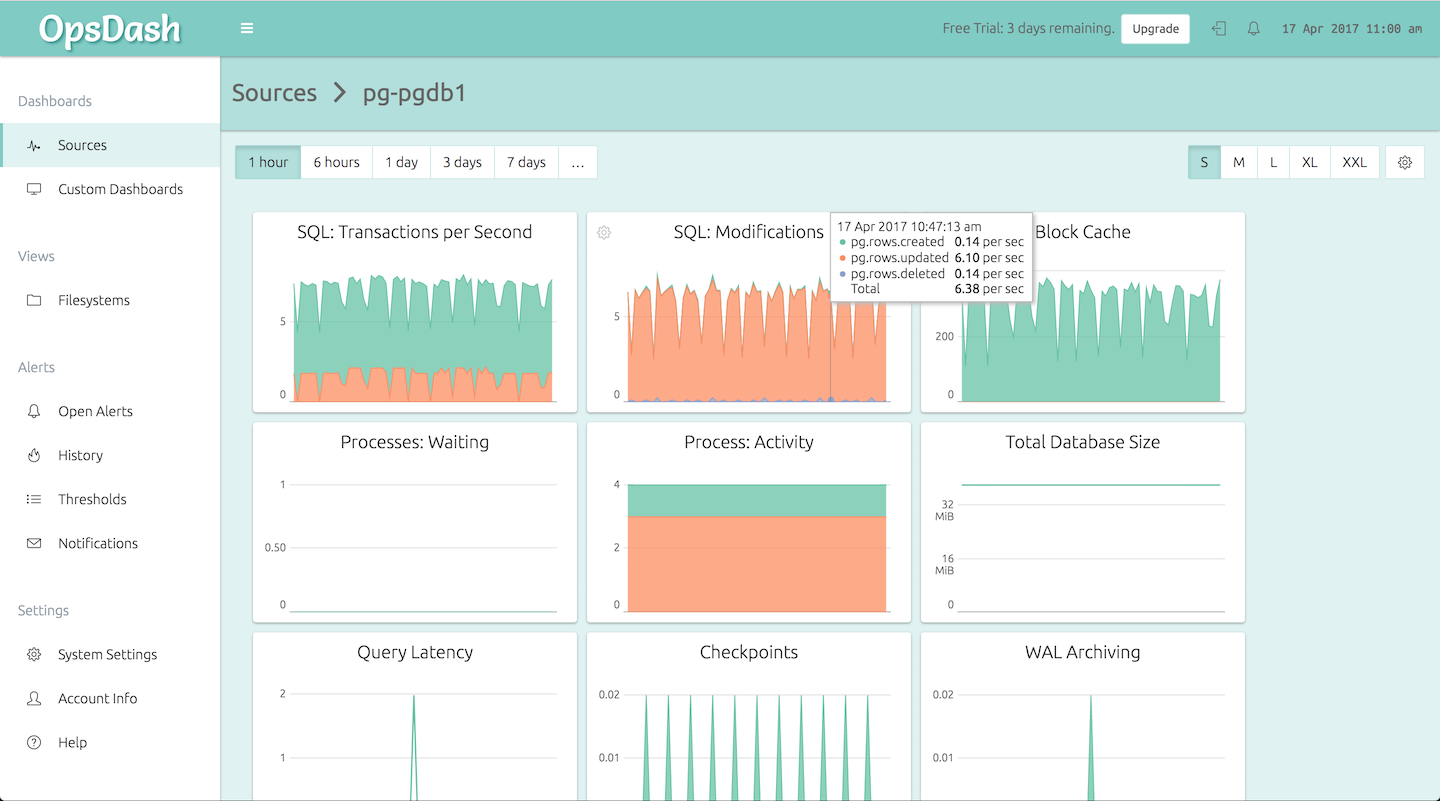
Database Monitoring
Monitor MySQL, PostgreSQL, MongoDB, Elasticsearch and more — get started fast with pre-configured dashboards.
Service Monitoring
Easily monitor Docker, Apache, Nginx, Redis and more — get started fast with pre-configured dashboards.
App Metrics Monitoring
Monitor your app metrics without setting up a separate system! Use StatsD and Graphite interfaces to push metrics into OpsDash.
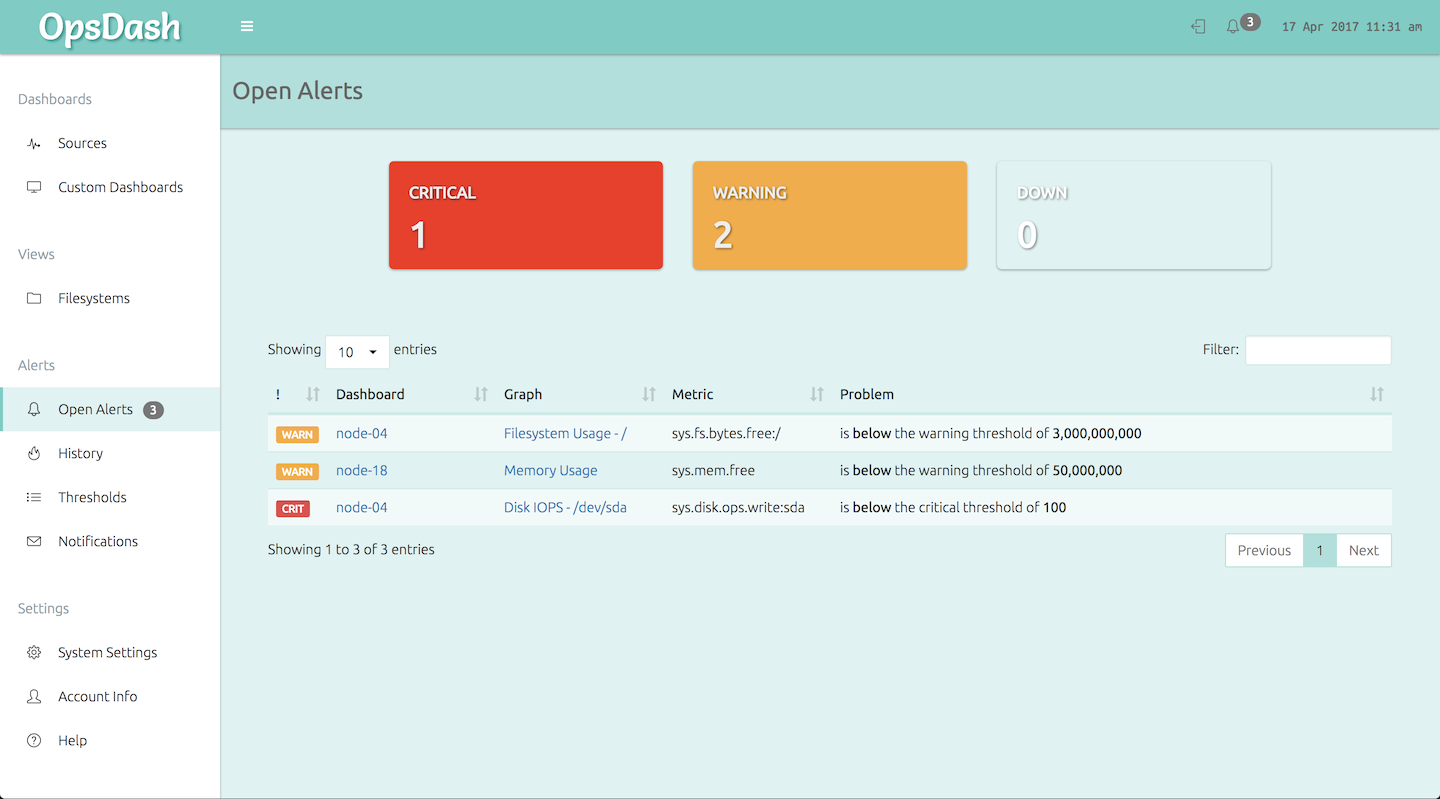
Alerting & Notification
Set critical and warning alert thresholds. Notify your team via e-mail, HipChat, Slack, PagerDuty, OpsGenie, VictorOps and Webhooks.
All The Integrations You Need...
![]()
![]()
![]()
![]()
![]()
![]()
![]()
![]()
![]()
![]()
![]()
![]()
![]()
![]()
![]()
![]()
![]()
![]()
![]()
![]()
Monitoring you will actually love!