Setting up monitoring for your servers and databases and apps – exciting, isn’t it?
No?
Yeah, we know. It’s one of those things that needs to be done, should be done, must be done, but really isn’t a whole lot of fun. Like, say, going to the dentist. Skip it and you risk a lot of pain, on the weekend, in the middle of the night … but yeah, there are certainly other things you might like to be doing.
Which is why we built OpsDash. OpsDash aims to get your monitoring up and running as quickly, easily as possible, and then gets out of your way. No complicated concepts to learn. No sorting out which metrics are important. No assembling dashboards.
We believe monitoring should alert you when stuff goes wrong. And help with locating the problem. Monitoring, like most else, should be practical and pragmatic.
We wish we could tell you that OpsDash will decentralize and streamline and seamlessly transform your IT and DevOps organizations to enable them to embrace a culture of digital transformation and analytics-driven decision making strategies to… uh, well. No. OpsDash just does monitoring.
Monitoring a Server
Here’s the dashboard for a server that you can get in less than five minutes of your time:
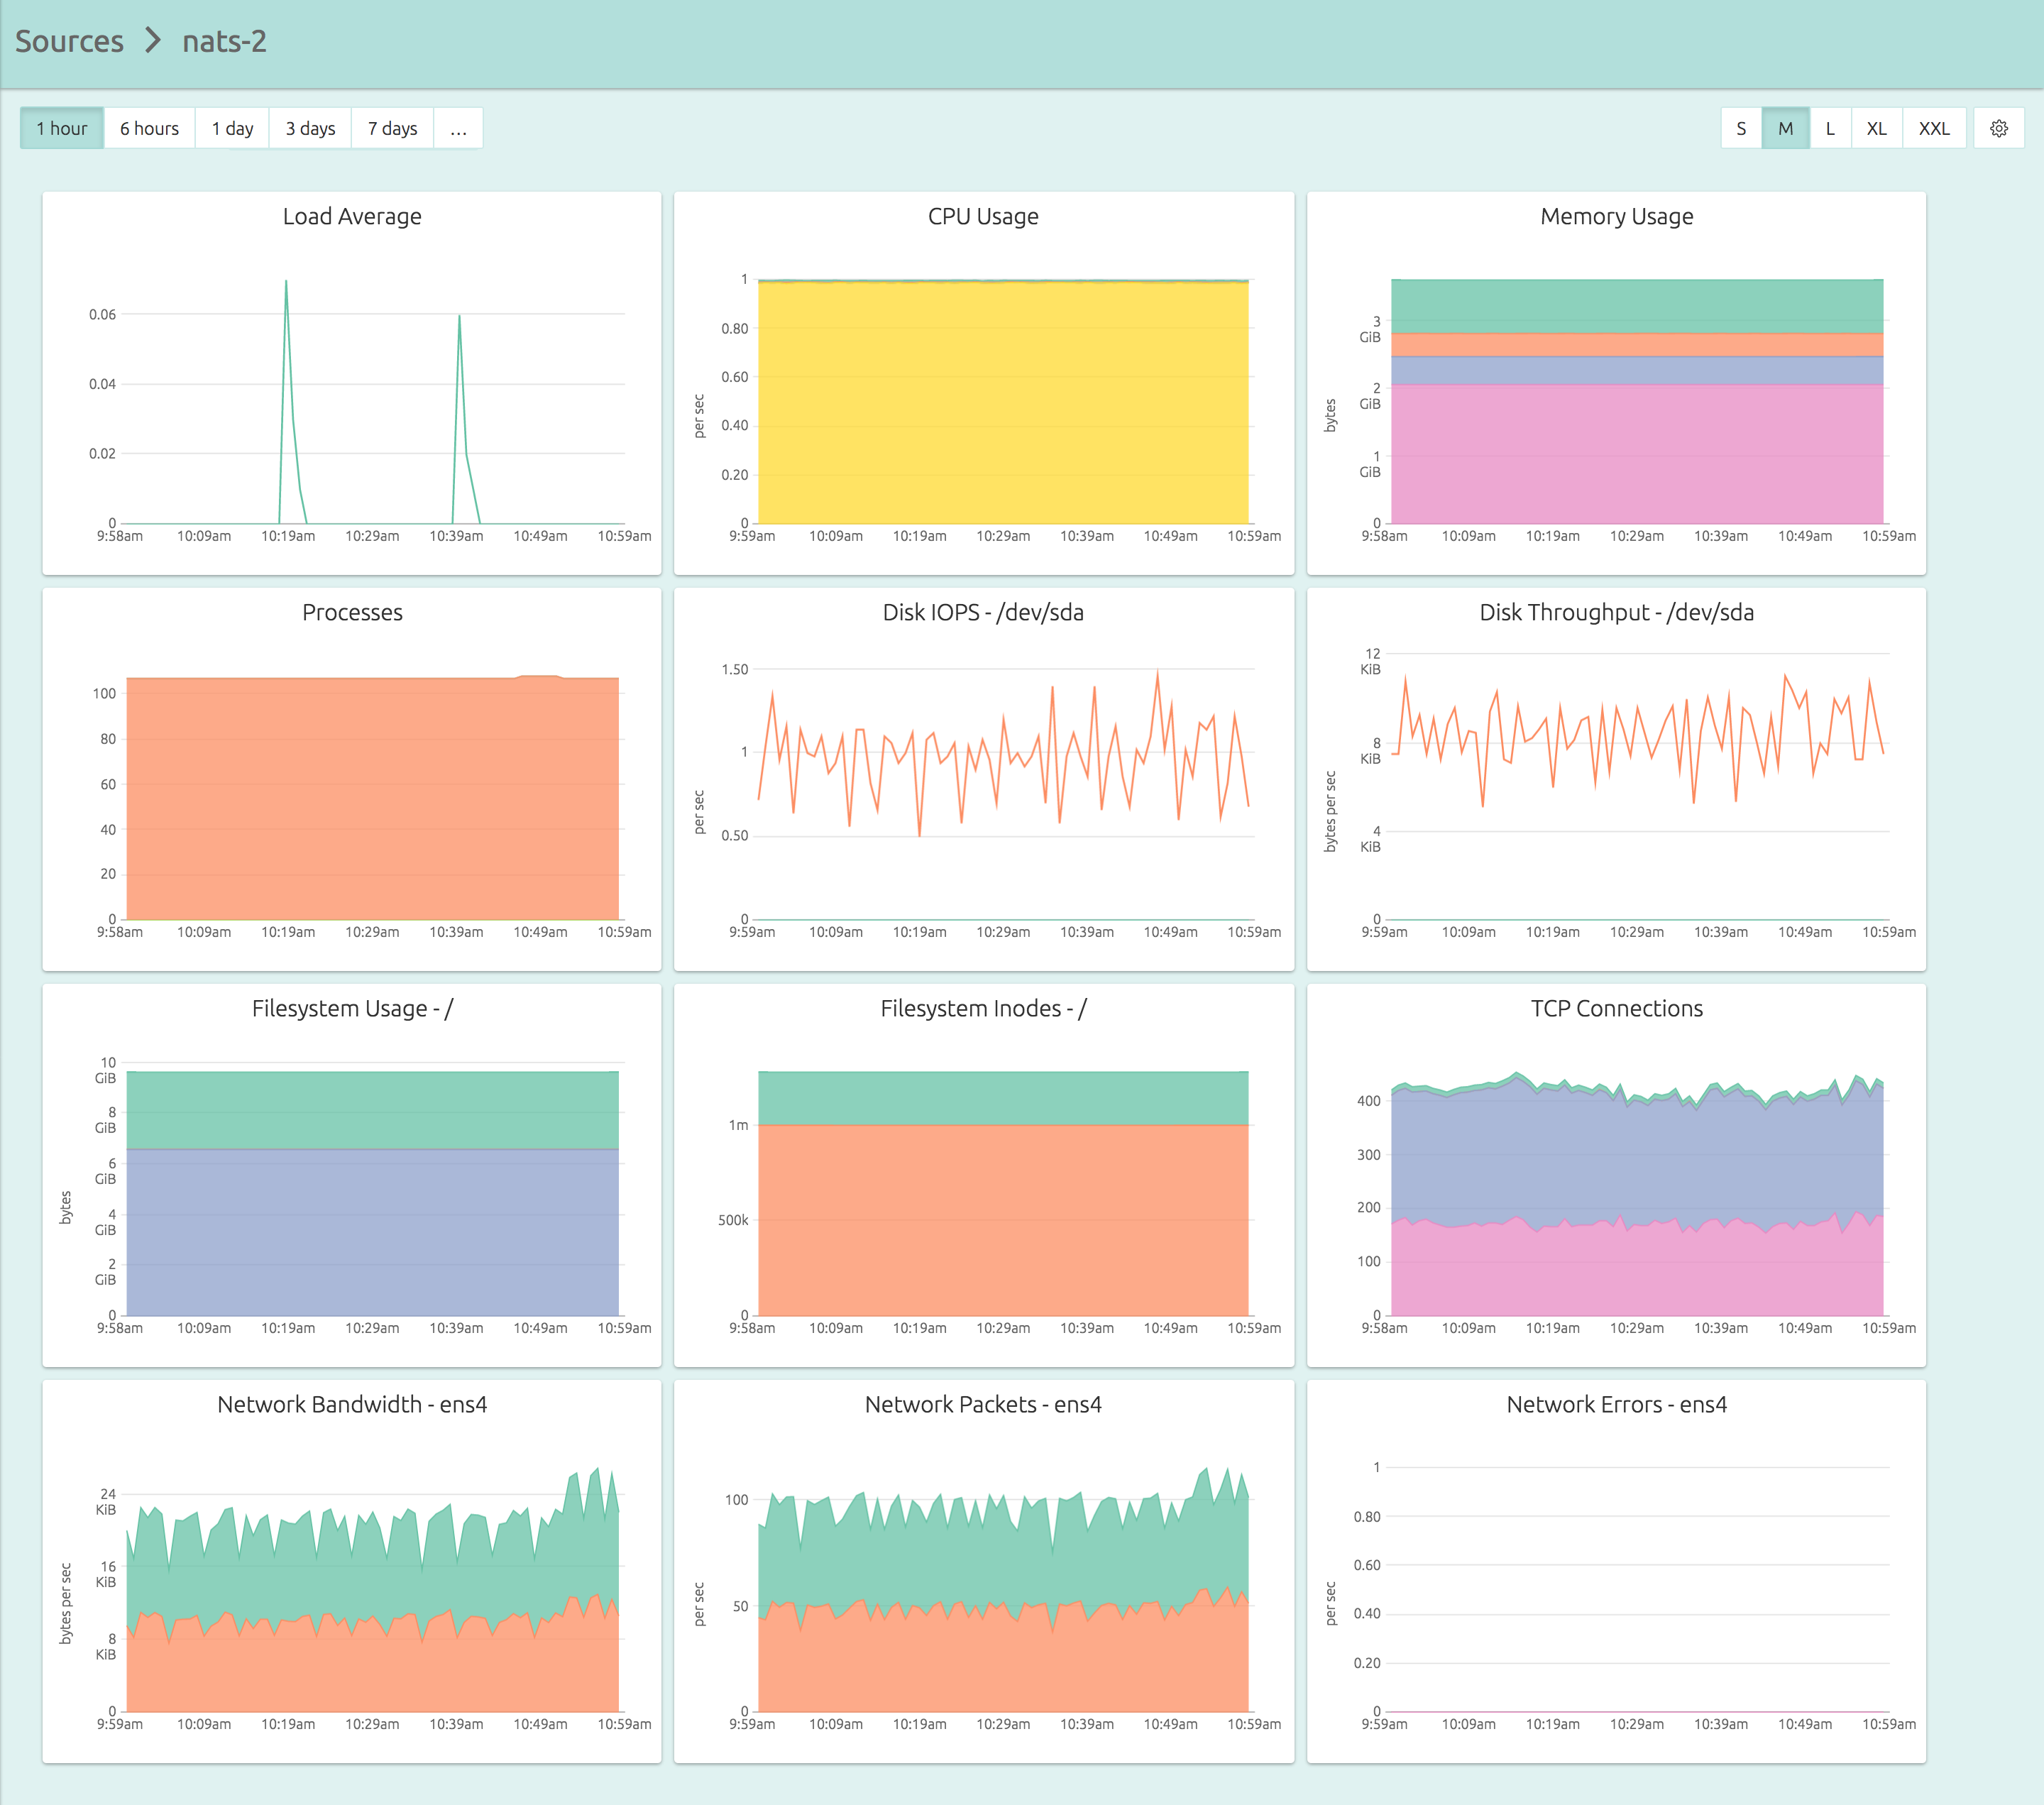
And here’s exactly what you need to do in those five minutes:
- Sign up for OpsDash SaaS here.
- Copy the API key from the Account Info page.
- SSH into your server, and install the agent, which can be as simple as:
wget https://packages.rapidloop.com/downloads/opsdash-smart-agent_1.3_amd64.deb
sudo dpkg -i opsdash-smart-agent_1.3_amd64.deb
sudo sed -i 's/YOUR_API_KEY_HERE/actual.api.key/' /etc/opsdash/agent.cfg
sudo service opsdash-agent start
Notice OpsDash didn’t make you design dashboards or figure out mount points. Your dashboard is setup and ready to use the moment you start the agent.
The Graphs
Let’s have a closer look at the graphs.
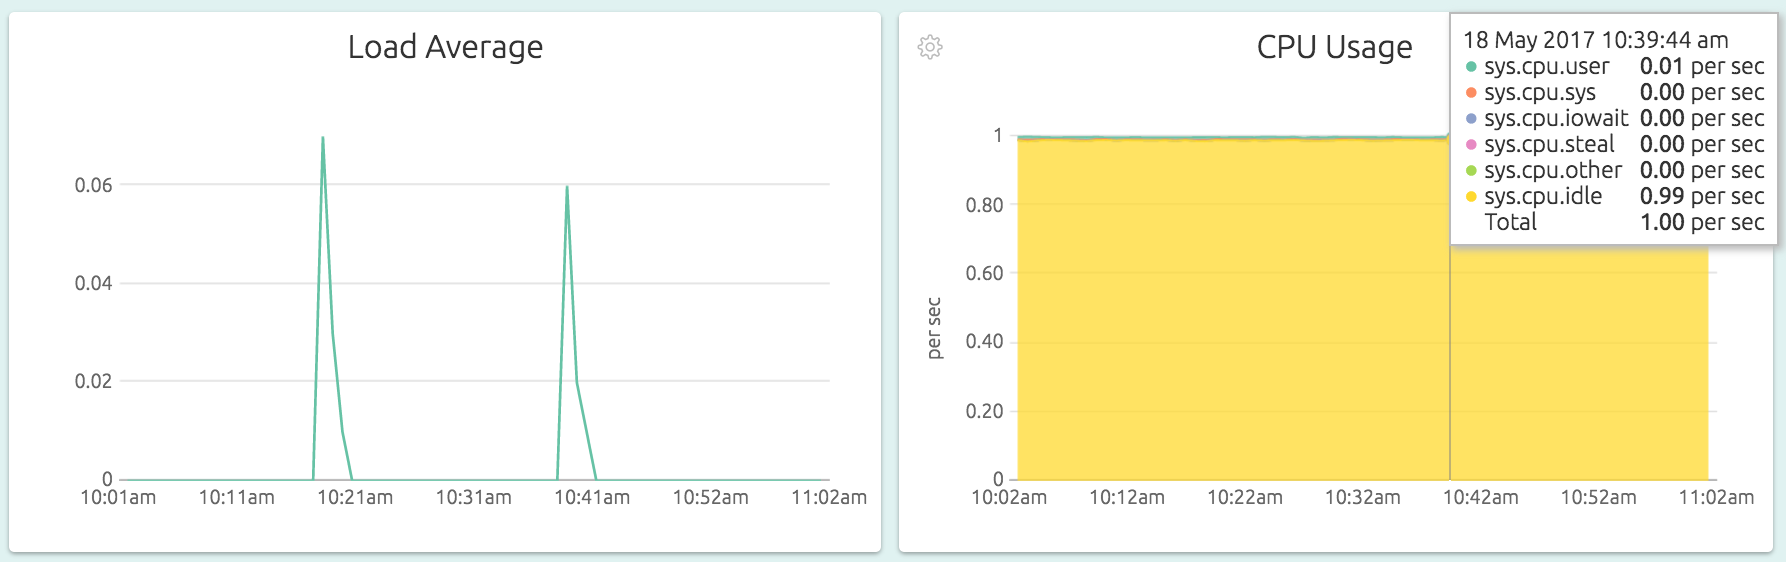
The Load Average graph shows the standard Linux load average value, a quick indicator of server load. The CPU Usage graph tracks what the CPUs spend it’s time doing, broken up into various types of activities. Read our CPU Usage blog post to learn more.
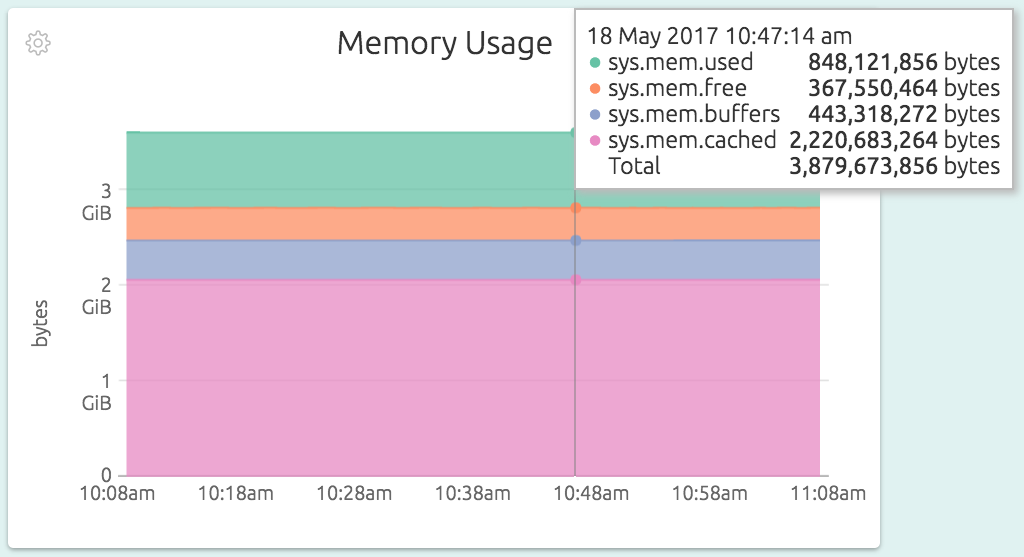
The Memory Usage graph shows what the memory is being used for. Here you can see that most of the memory is being used for buffers and block cache, and the actual usage by processes is only about 840 MB or so. The buffers and cache usage is just Linux putting free memory to good use, and will be handed over to processes on demand.
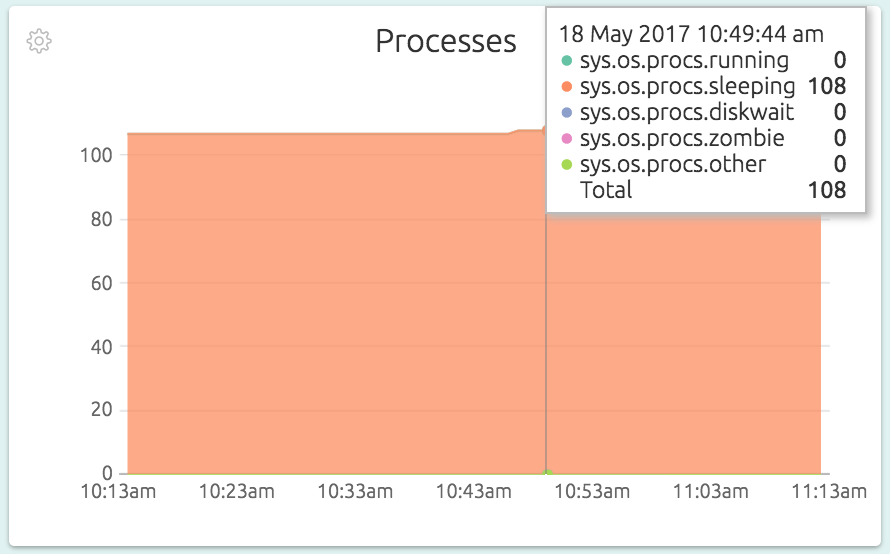
Processes are typically running, waiting for disk I/O to complete, or waiting for other things like network. The Processes graph shows you what they are up to. A quick check of this graph is all it takes to figure out if your processes are blocked on disk I/O or not.
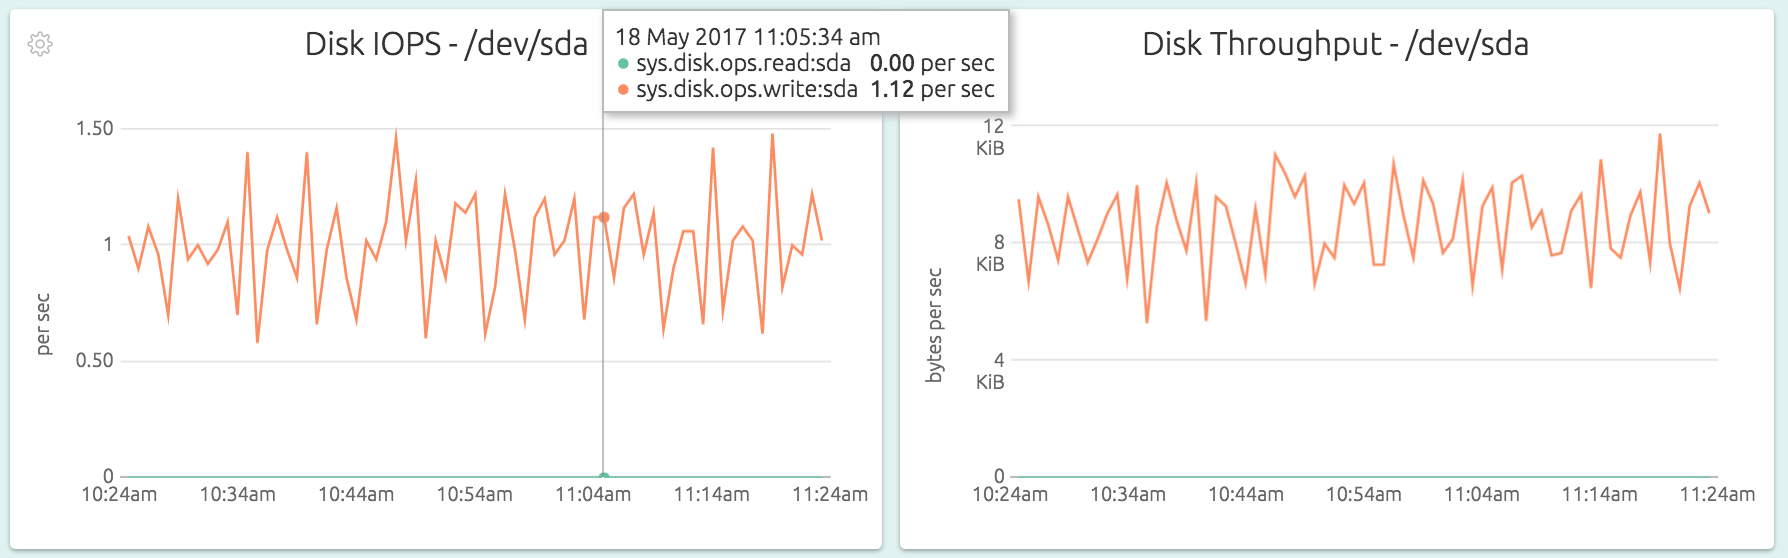
The OpsDash Smart Agent can detect what disks are present in the system that need monitoring (you can always tweak this in the configuration). For each disk, OpsDash shows the read and write operations per second (IOPS) and amount of data in bytes that is read from and written to the disk.
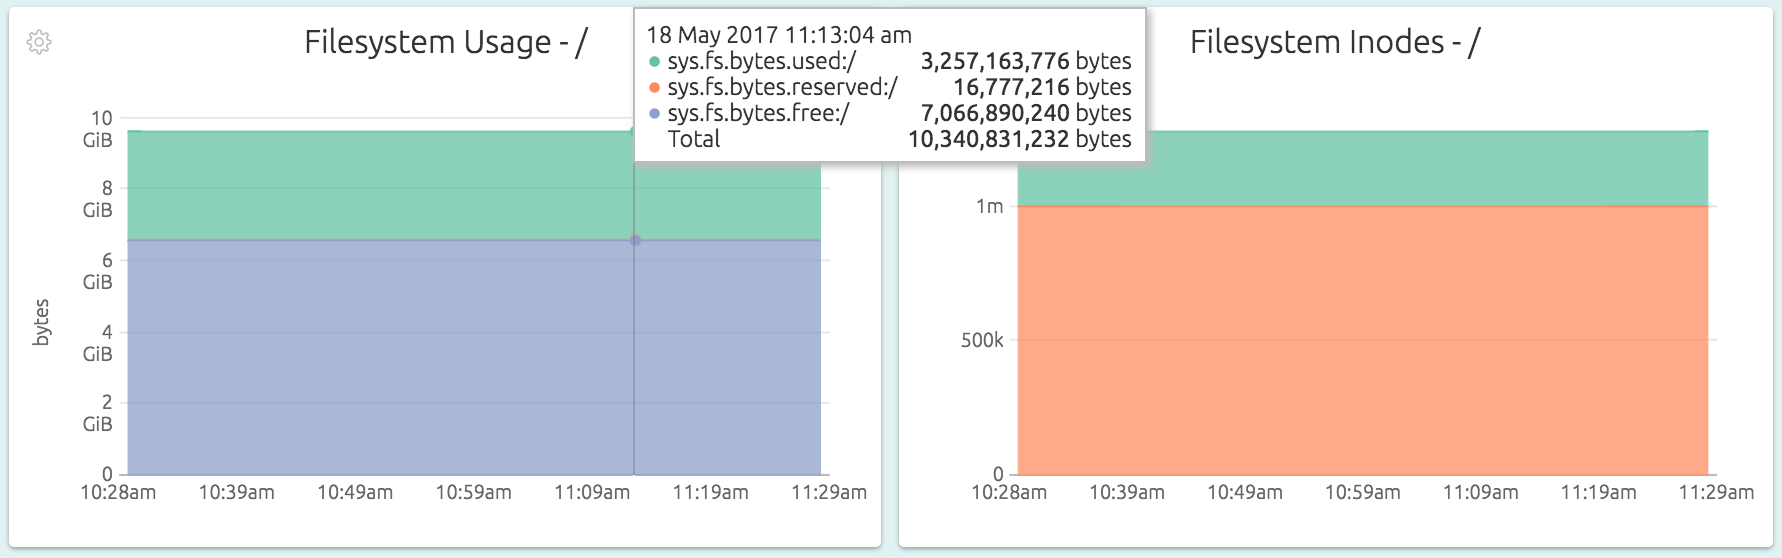
Similarly, for each mounted filesystem (that looks monitoring-worthy to the agent), the disk and inode usage is tracked.
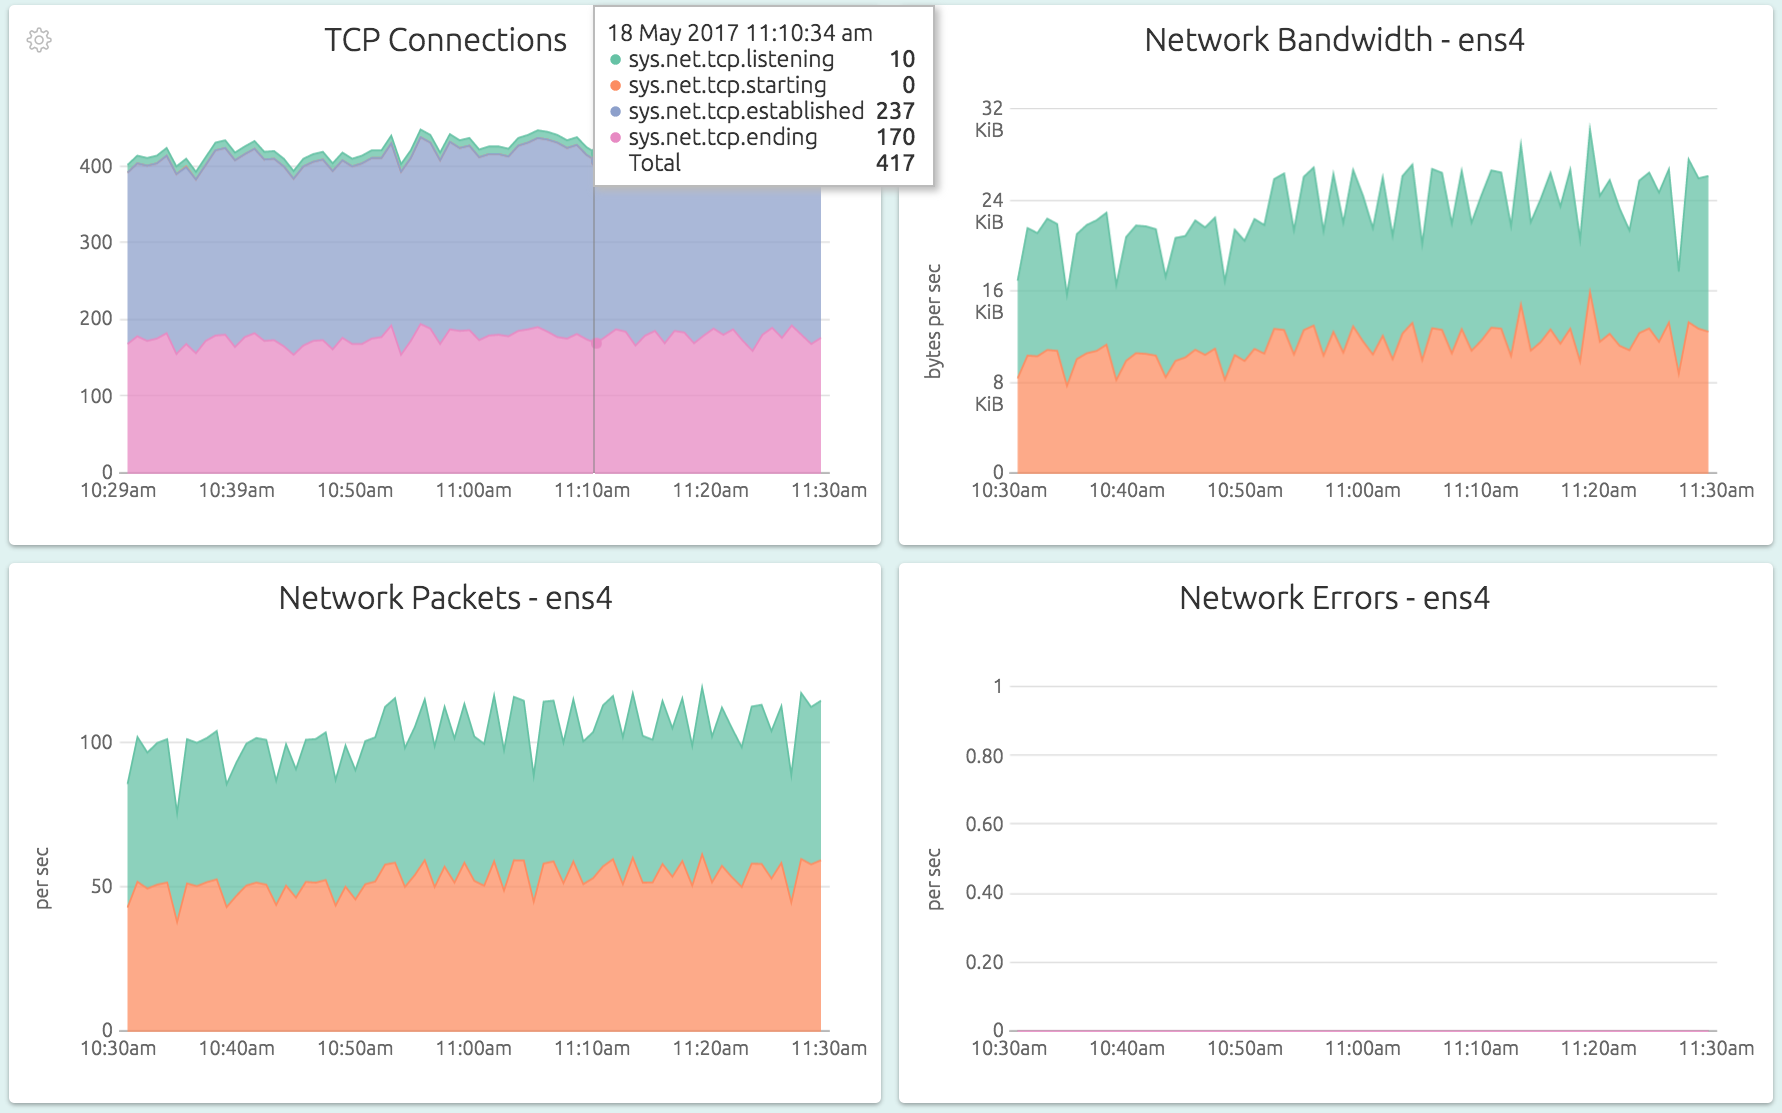
The network graphs track bandwidth, traffic and TCP usage in detail. The TCP Connections graph gives a break down of currently allocated TCP connetions in various states – listening, starting, established or ending. The Network Bandwidth and Network Packets graphs show the transmitted and received data in bytes, and packet counts. Network Errors are the interface-level error counts.
The network graphs are available for each “interesting” network interface available on the system. Note that the agent did not gather metrics for the “lo” interface – although you can ask it to in the configuration if you want to.
There’s more!
There’s a lot more we’d love to tell you about OpsDash – but how much can we stuff into a single blog post, eh? We’d want to tell you about..
- ..how monitoring Apache, Nginx, MySQL, PostgreSQL, MongoDB, Memcache, Redis, Elasticsearch is just as easy
- ..how you can easily setup alerts and send notifications to Slack, HipChat, email, PagerDuty, OpsGenie or Webhooks
- ..how you can send in your application metrics also into OpsDash with StatsD and Graphite interfaces of the agent
- ..how you can setup custom dashboards, group sources to monitor aggregate data, monitor ARM servers and devices, use the API, self-host OpsDash yourself, and lots more!
Talk to us about your monitoring needs, and let’s discuss how we can help you – reach us at hello@rapidloop.com or @therapidloop.