So, the monitoring you’ve got in place just isn’t cutting it anymore. With OpsDash, you can easily set up comprehensive monitoring and alerting for your full stack, and it will be quick and painless.
Let’s take a look at an example. Say your stack includes a bunch of VMs, Apache, and MySQL running somewhere in the cloud. You want to monitor everything and you also have a web app written in Golang and need to monitor a few app metrics as well.
No problem! With OpsDash, you can start monitoring all of these in just a few minutes, with great looking live, read-only shareable dashboards. You can easily set up alerts and notifications with OpsDash as well.
Let’s take a look and see how to do this in more detail.
Monitoring a Server
Here’s the dashboard for a server that you can get in less than five minutes of your time:
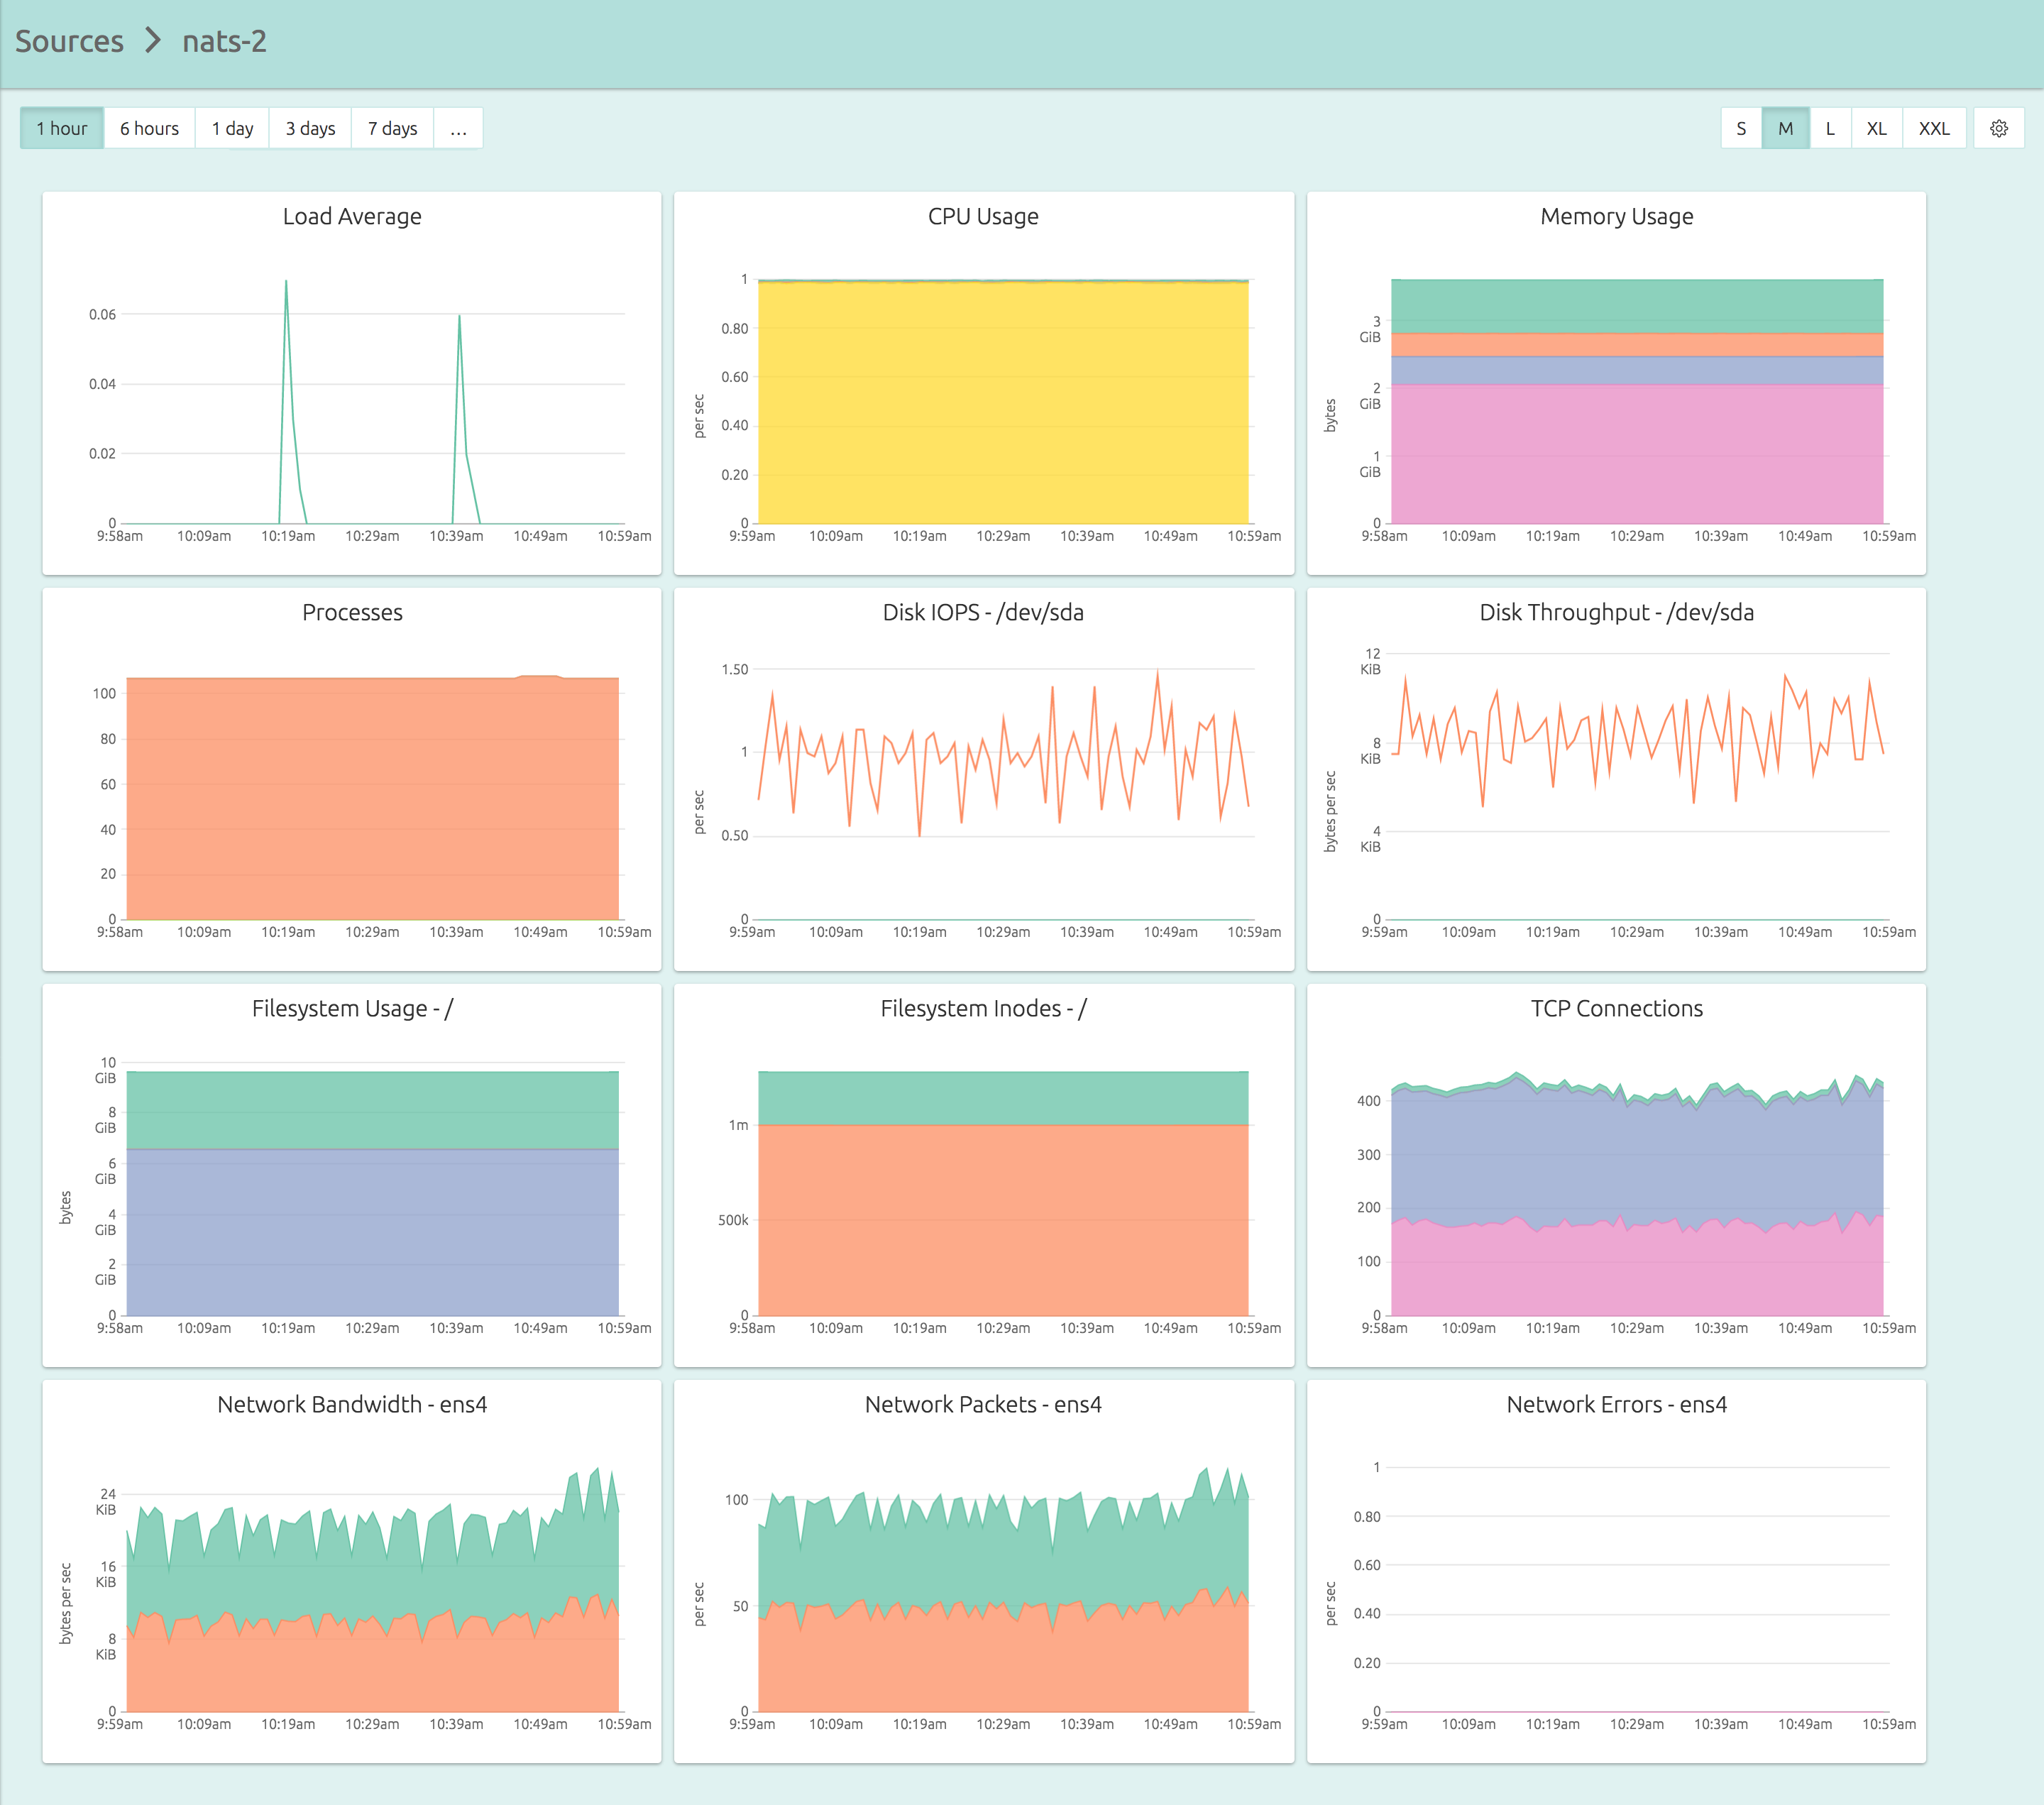
And here’s exactly what you need to do in those five minutes:
- Sign up for OpsDash SaaS here.
- Copy the API key from the Account Info page.
- SSH into your servers, and install the agent, which can be as simple as:
wget https://packages.rapidloop.com/downloads/opsdash-smart-agent_1.3_amd64.deb
sudo dpkg -i opsdash-smart-agent_1.3_amd64.deb
sudo sed -i 's/YOUR_API_KEY_HERE/actual.api.key/' /etc/opsdash/agent.cfg
sudo service opsdash-agent start
Note that OpsDash didn’t make you design dashboards or figure out mount points. Your dashboards are setup and ready to use the moment you start the agent.
Find out more about OpsDash server monitoring, including how the OpsDash Smart Agent can be used to automatically configure your server monitoring dashboards in our server monitoring blog post.
Apache Monitoring With OpsDash
Here’s how a default, out-of-the-box Apache dashboard looks:
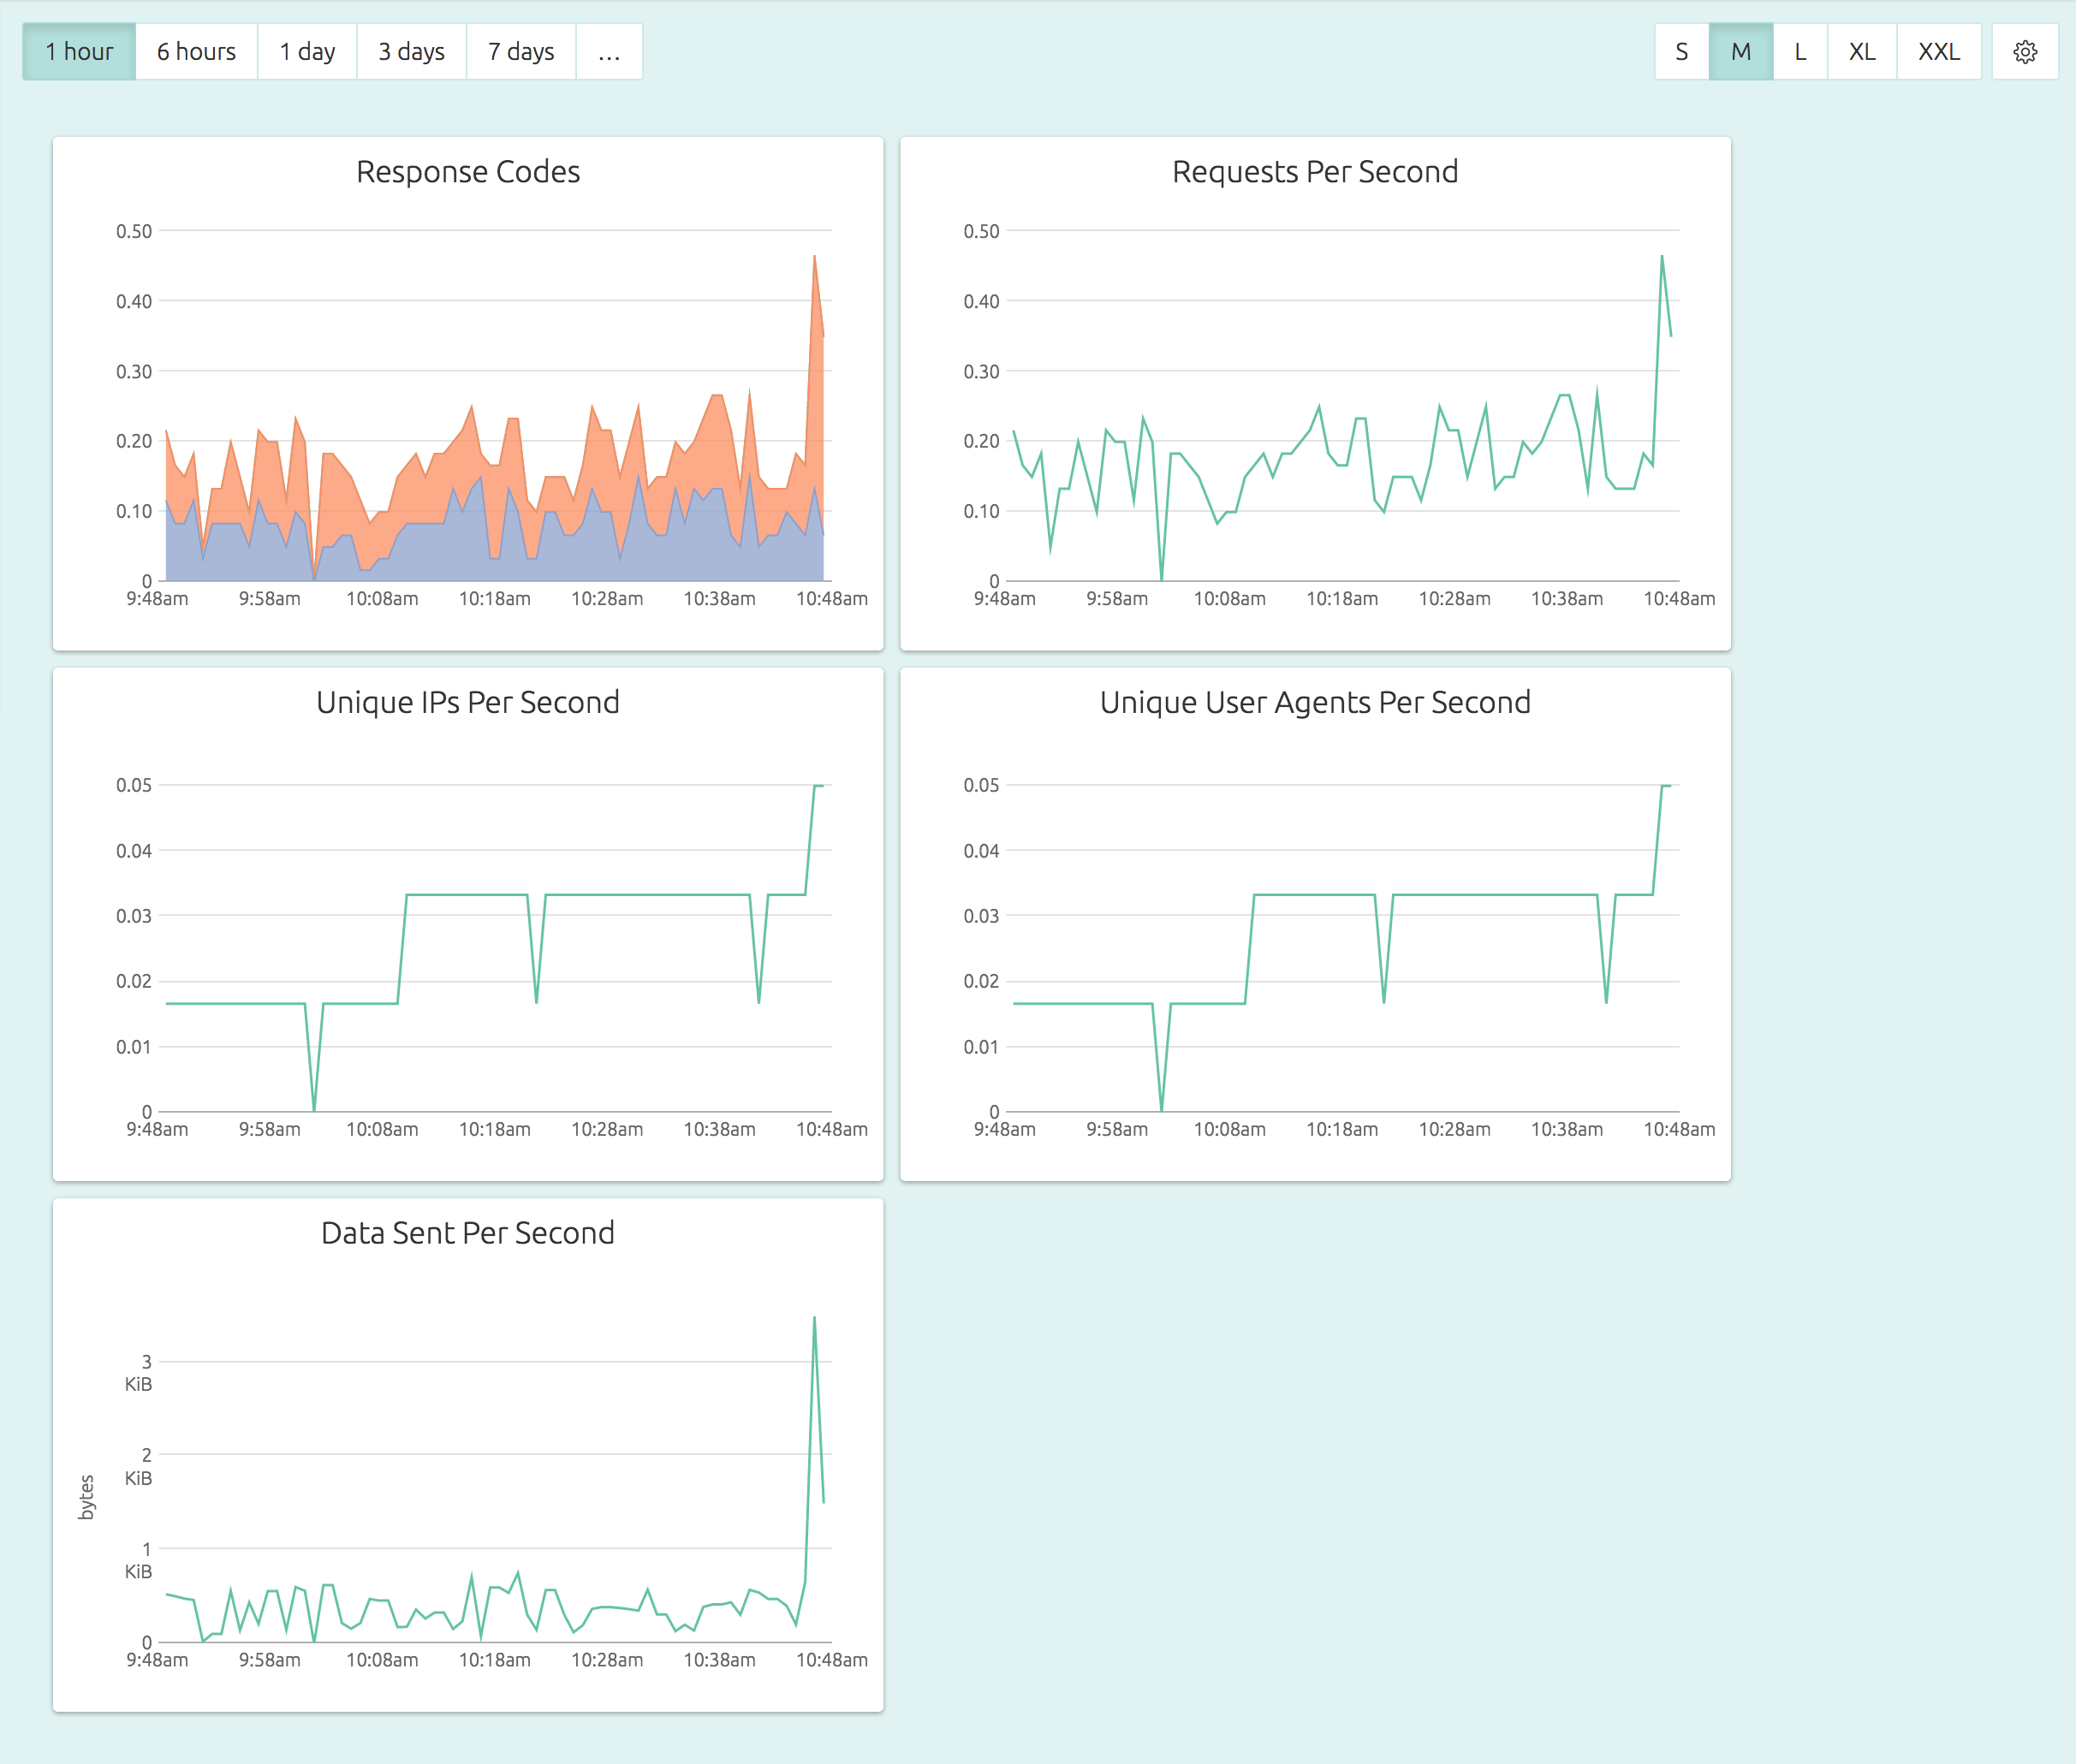
In OpsDash, you can easily set alerts like “if number of number of 5xx responses per second exceed 100, notify me on Slack” in just a few clicks.
Here is how the Response Codes graphs looks in detail:
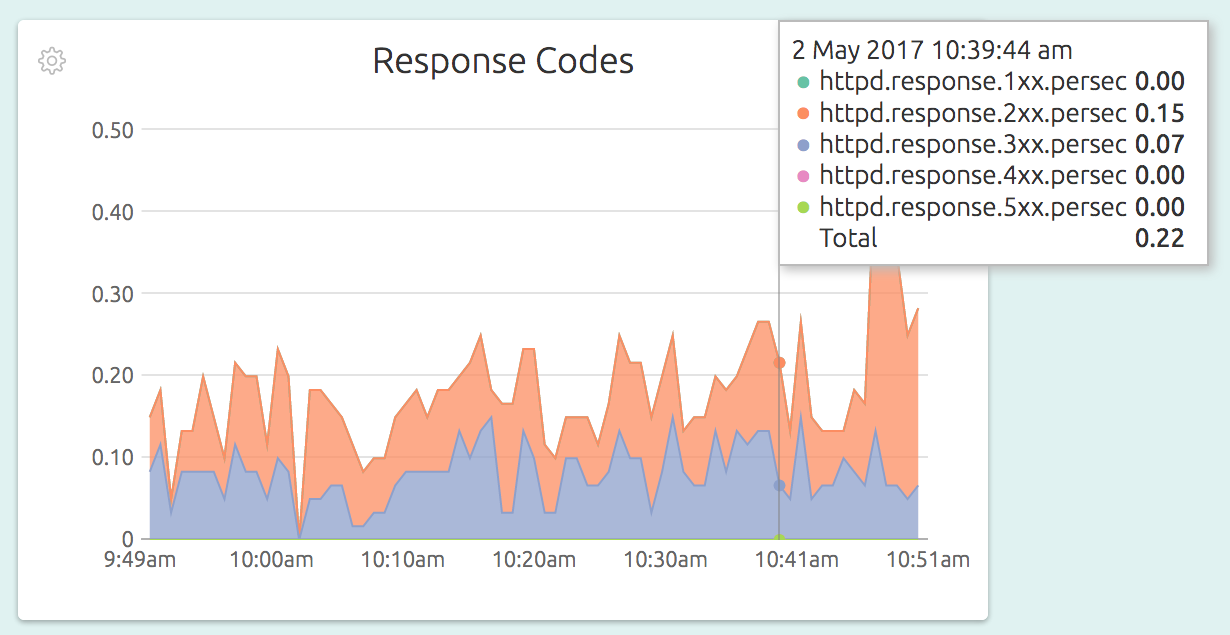
All that is needed for this level of monitoring is to have exactly 4 lines in your OpsDash Smart Agent configuration file – like this:
service "apache-main" {
     type = "apache"
     logs = "/var/log/apache2/access.log"
}

service "apache-myvhost" {
     type = "apache"
     logs = "/var/log/apache2/myvhost-access.log"
}

service "apache-all-vhosts" {
     type = "apache"
     logs = "/var/log/apache2/*vhost*-access.log"
}
The configuration has 3 entries (they show up as 3 separate dashboards in the UI), one for the main Apache server, one for a single virtual host, and another for all the virtual hosts combined.
Read more about how the OpsDash Smart Agent actually monitors your Apache servers here.
Monitoring MySQL Servers With OpsDash
OpsDash makes it easy to monitor your MySQL servers, including replication at both master and slave instance sides.
Here’s how OpsDash’s curated dashboards come out of the box:
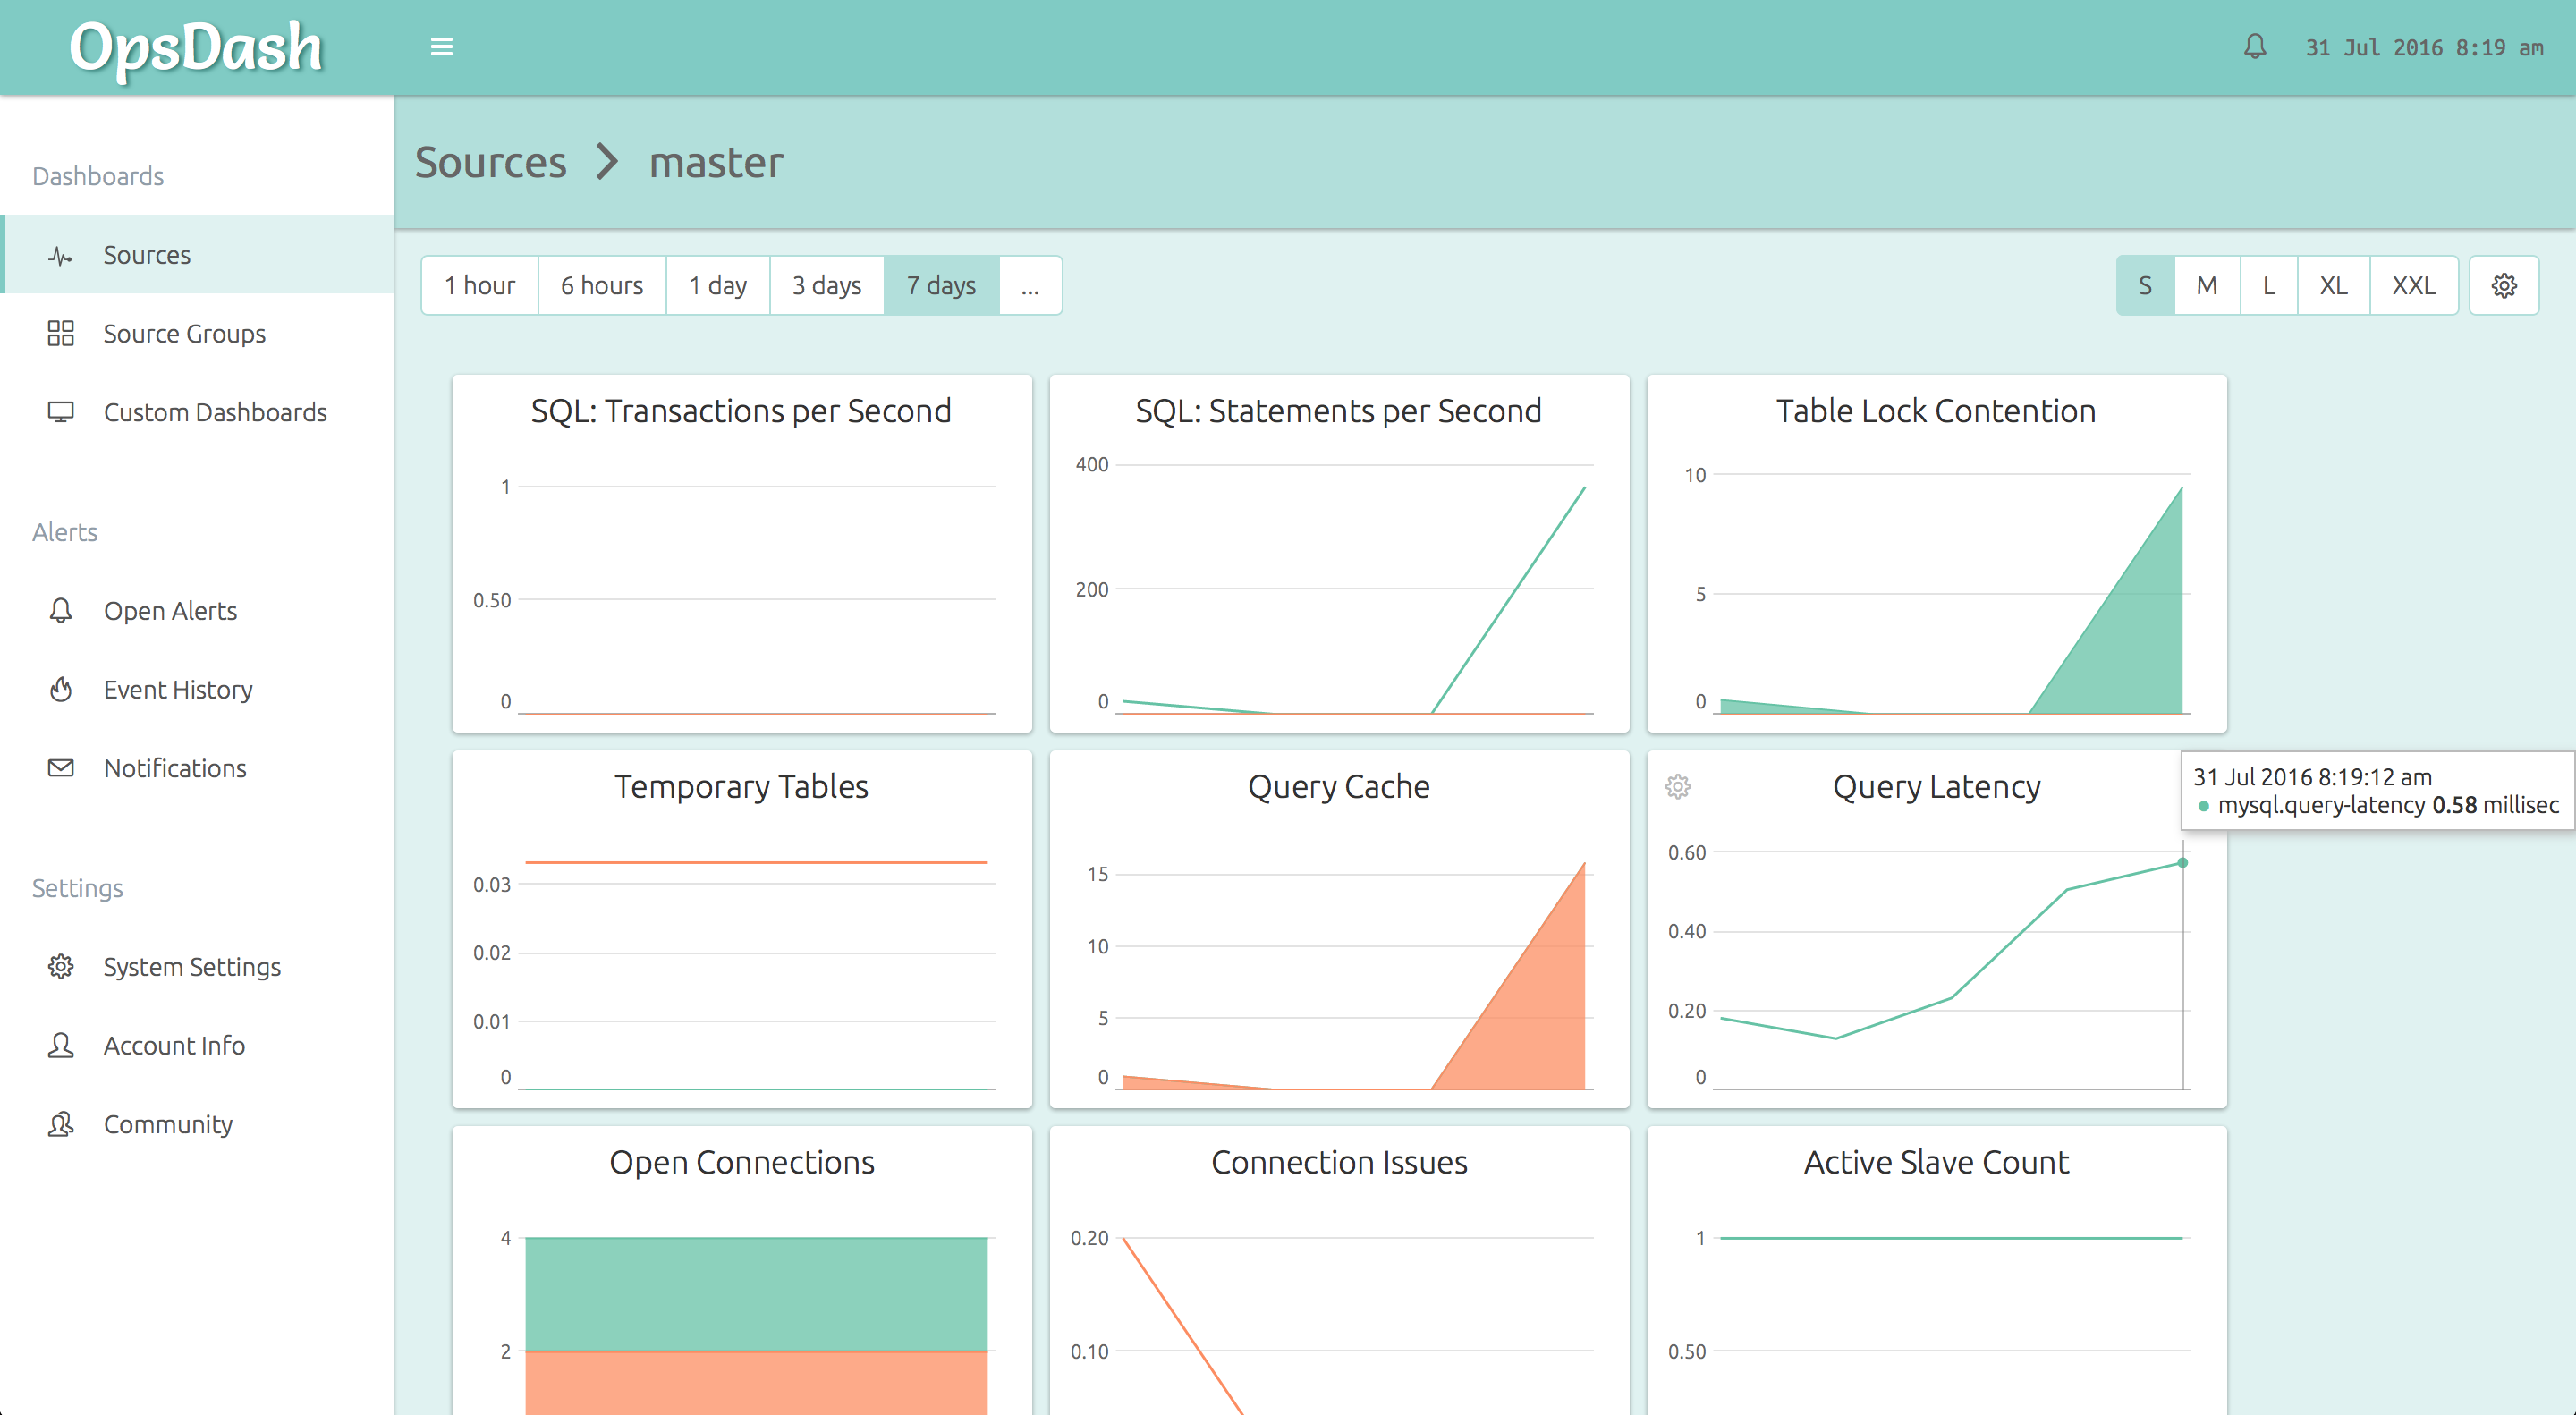
You can go from 0 to this in just a minute or two!
No messing around with individual metrics, figuring out which of them are important, no editing graph templates. OpsDash comes with smart, sensible defaults for everything which you can customize later on.
Typically, all that’s needed to ensure effective monitoring is to observe the data for a while and set alerts to notify you via Email, Slack, HipChat or PagerDuty if things go wrong.
To get started, install the OpsDash Smart Agent if you haven’t done so already.
We recommend creating a separate user for OpsDash to connect and get at the MySQL metrics. You can create a user like so:
mysql> CREATE USER opsdash@localhost IDENTIFIED BY 'p@ssw0rd';
Query OK, 0 rows affected (0.00 sec)

mysql> GRANT PROCESS, REPLICATION CLIENT ON *.* TO opsdash@localhost;
Query OK, 0 rows affected (0.00 sec)
OpsDash needs the PROCESS and REPLICATION CLIENT privileges to query the status of replication.
You can then edit the configuration file at /etc/opsdash/agent.cfg to tell
OpsDash to monitor the MySQL server.
service "master" {
    type = "mysql"
    host = "127.0.0.1"
    user = "opsdash"
    pass = "p@ssw0rd"
}
Here we are assuming the agent is installed on a MySQL master instance, being replicated to another instance.
Now ask the agent to reload the configuration:
$ sudo service opsdash-agent reloadNote that if you haven’t started the agent yet, you’ll need to start it instead of reload-ing it.
Repeat the process on the slave node.
For more details on the MySQL monitoring dashboard and graphs that are automatically set up check out our MySQL blog post.
Monitoring App Metrics With OpsDash
There are many ways to monitor app metrics. You can send in your application metrics into OpsDash with StatsD and Graphite interfaces of the OpsDash Smart Agent. In this example, let’s take a look at how you could use StatsD to send in metrics from your Go web app.
The StatsD on-wire text protocol is so simple it hardly needs any vendored library. Essentially, you can send text strings in this format to an UDP port. Here’s the complete source of a fully functional StatsD client:
package util

import (
	"fmt"
	"io"
	"net"
	"time"
)

var queue = make(chan string, 100)

func init() {
	go statsdSender()
}

func StatCount(metric string, value int) {
	queue <- fmt.Sprintf("%s:%d|c", metric, value)
}

func StatTime(metric string, took time.Duration) {
	queue <- fmt.Sprintf("%s:%d|ms", metric, took/1e6)
}

func StatGauge(metric string, value int) {
	queue <- fmt.Sprintf("%s:%d|g", metric, value)
}

func statsdSender() {
	for s := range queue {
		if conn, err := net.Dial("udp", "127.0.0.1:8125"); err == nil {
			io.WriteString(conn, s)
			conn.Close()
		}
	}
}
As you can see, the code is quite simple. The metrics are pushed into a channel to allow the caller to continue ASAP. The statsdSender then writes each measurement into a StatsD-compatible agent on localhost.
The util.Stat* functions are meant to be used from application code, like so:
func (foo *Bar) Parse() error {
	t := time.Now()
	defer func() {
		util.StatTime("parse.timetaken", time.Since(t))
	}()

	// ... do stuff ...
}

func (foo *Bar) Compile() error {

	if err := foo.Parse(); err != nil {
		util.StatCount("parse.failures", 1)
		// ...
	}

	// ...
}
If you anticipate that too many metrics might get pushed into the channel, have a look at the client-side sampling rate feature of the StatsD protocol.
In the code above, the metrics are pushed into a StatsD running on localhost.
For OpsDash, we actually use nearly the same code above in production, and we don’t have a StatsD on each node! The OpsDash Smart Agent includes built-in StatsD and graphite daemons. Naturally, we use OpsDash itself to monitor the SaaS version of OpsDash!
Here’s a snippet of the agent configuration file /etc/opsdash/agent.cfg:
statsd {

	# You can enable the statsd interface by setting this to 1.
	enabled = 1

	# For timing metrics, percentiles are computed as per this list. Values
	# must be comma-separated integers in ascending order. Default value is
	# "90,95,99".
	#percentiles = "90,95,99"

	# When enabled, OpsDash will listen on *:8125/tcp and *:8125/udp for
	# statsd connections. Uncomment to change the IP or port it listens on.
	#bind.udp = "0.0.0.0:8125"
	#bind.tcp = "0.0.0.0:8125"
}
The OpsDash Smart Agent runs on each node and accepts the StatsD metrics from the application code. It then forwards it to the OpsDash SaaS server, where it can be graphed and alerted upon. Here’s how the above metrics will look on an OpsDash custom dashboard:
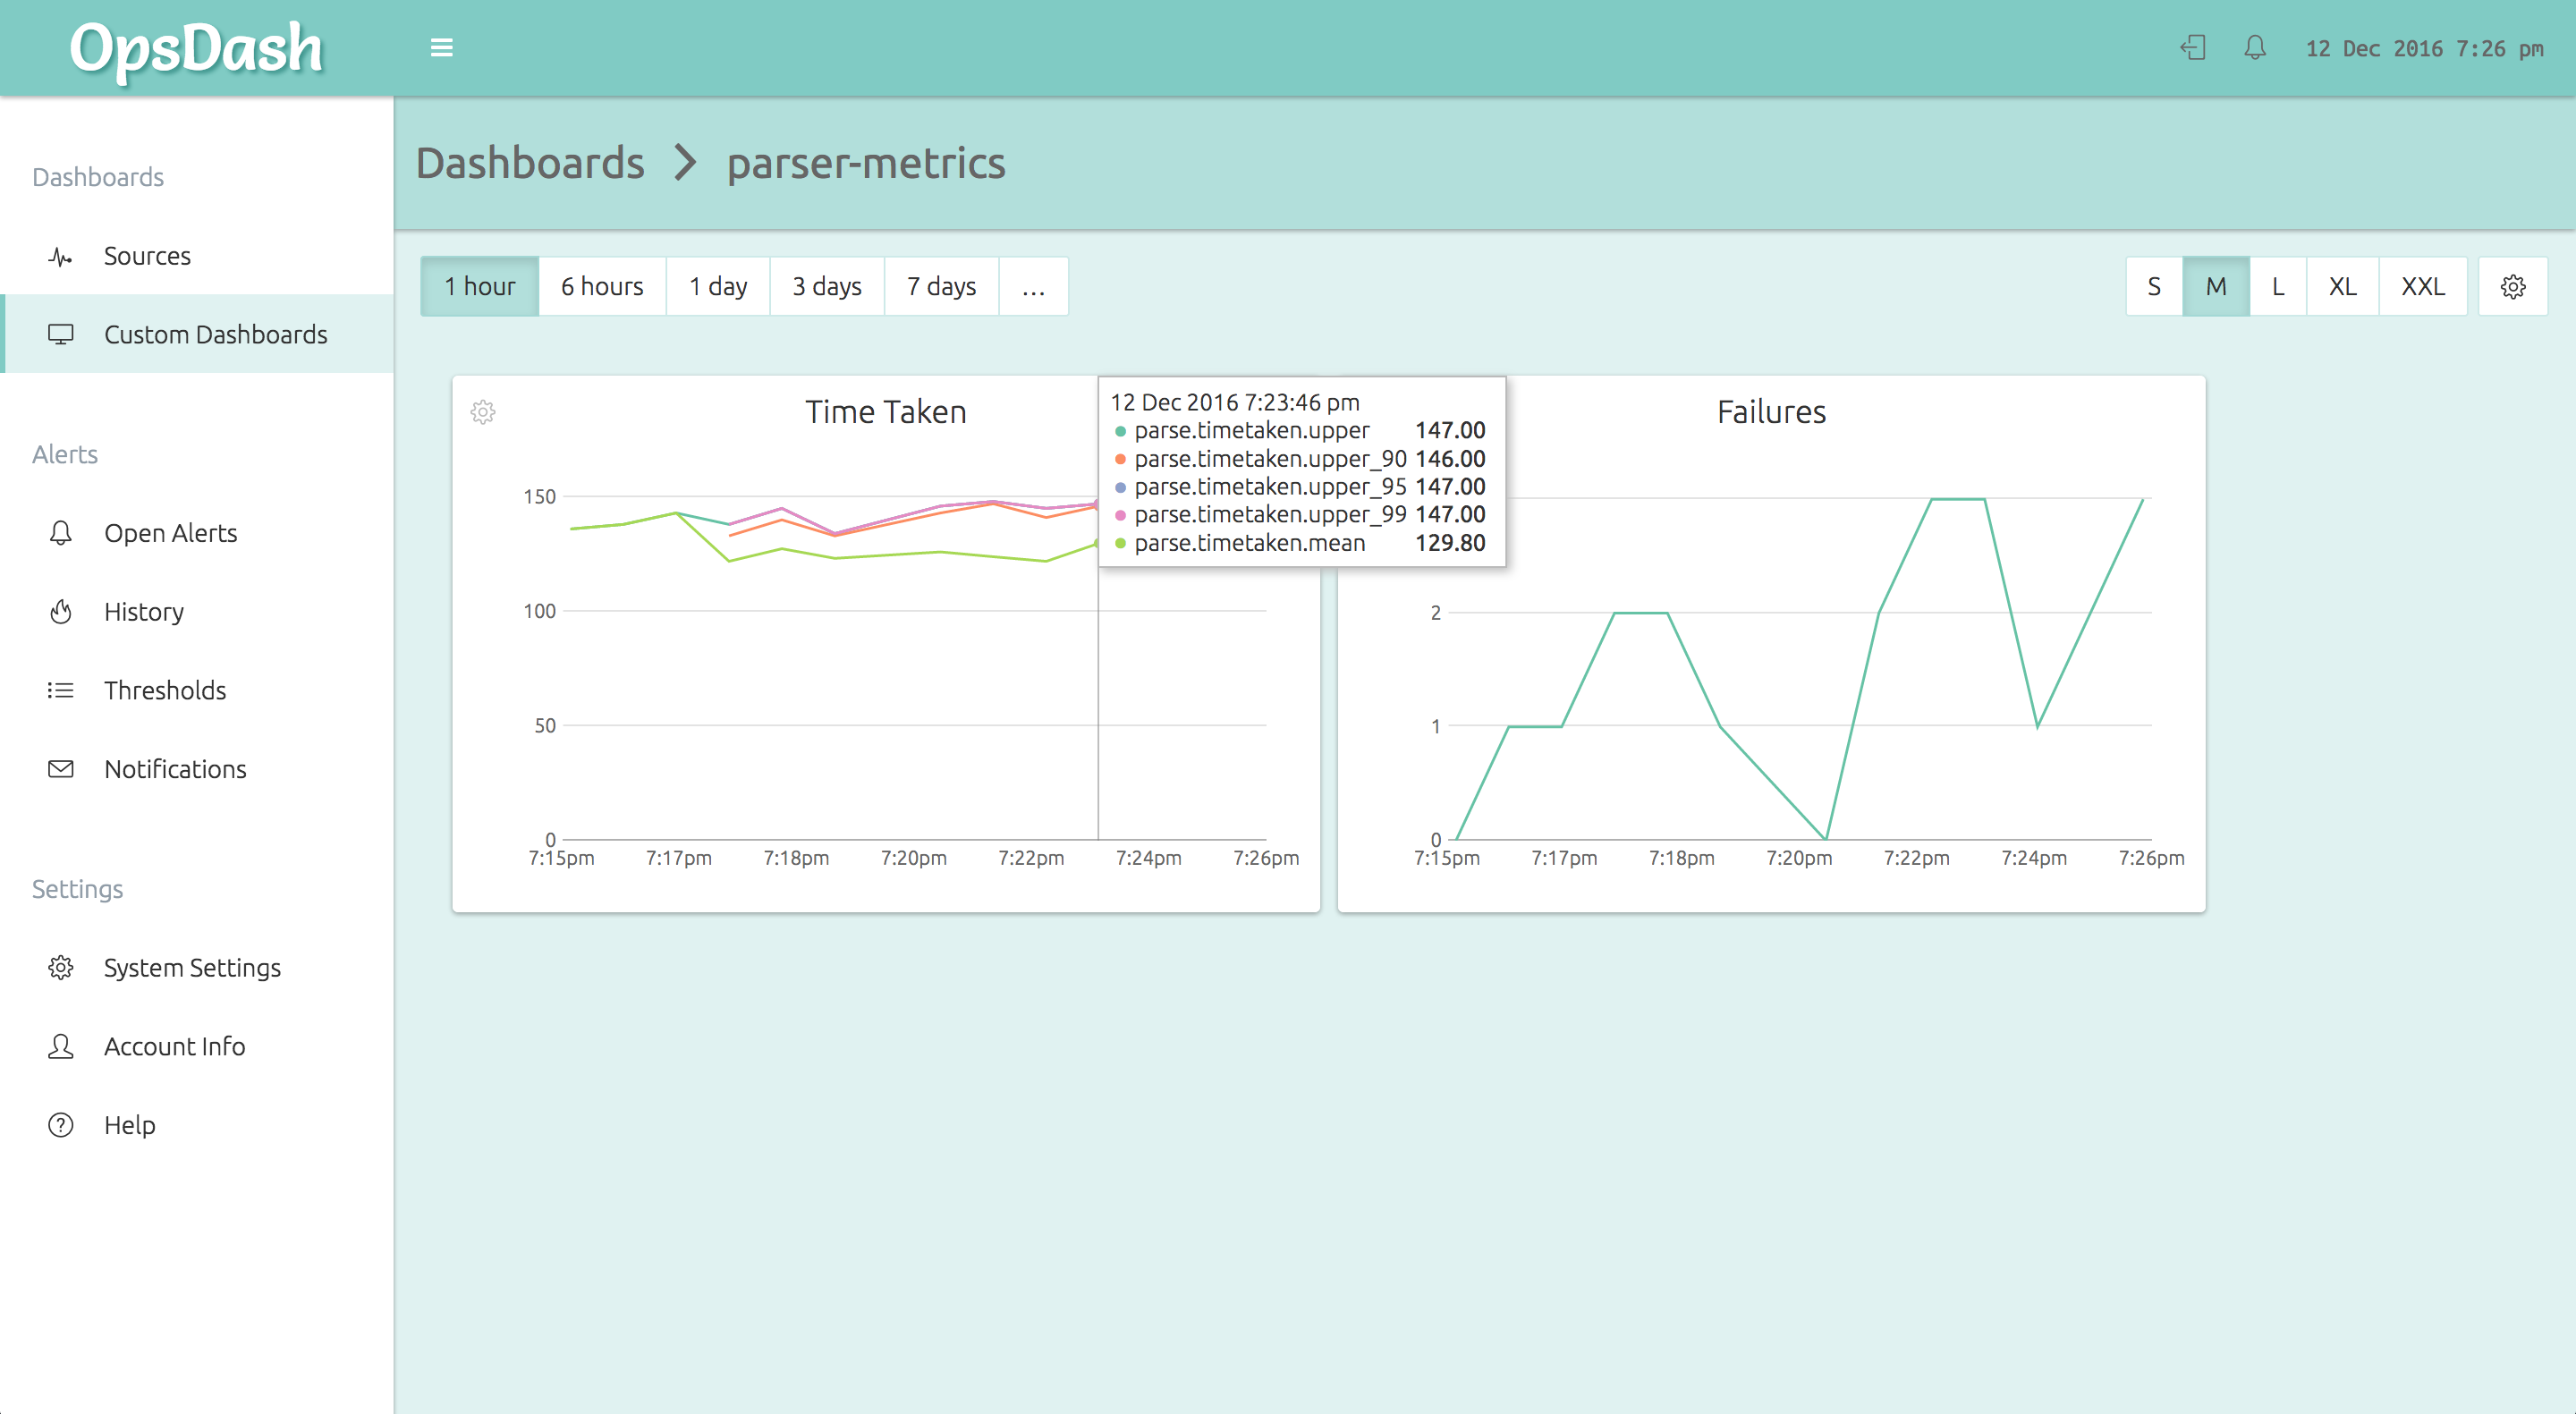
As you can see, in a few minutes you can get monitoring up and running across your stack with OpsDash. No prerequisites to configure and install. No need to design every dashboard from scratch. With OpsDash, you can get comprehensive monitoring setup quickly. Then, as your needs evolve or as you have time, you can go back and refine and customize.
There’s more!
There’s a lot more we’d love to tell you about OpsDash – but how much can we stuff into a single blog post, eh? We’d want to tell you about..
- ..how monitoring Nginx, PostgreSQL, MongoDB, Memcache, Redis, Elasticsearch is just as easy
- ..how you can easily setup alerts and send notifications to Slack, HipChat, email, PagerDuty, OpsGenie or Webhooks
- ..how you can setup custom dashboards, group sources to monitor aggregate data, monitor ARM servers and devices, use the API, self-host OpsDash yourself, and lots more!
Talk to us about your monitoring needs, and let’s discuss how we can help you – reach us at hello@rapidloop.com or @therapidloop.